Immigrants vs Fijian Median Earnings
COMPARE
Immigrants
Fijian
Median Earnings
Median Earnings Comparison
Immigrants
Fijians
$46,478
MEDIAN EARNINGS
51.6/ 100
METRIC RATING
170th/ 347
METRIC RANK
$40,193
MEDIAN EARNINGS
0.0/ 100
METRIC RATING
317th/ 347
METRIC RANK
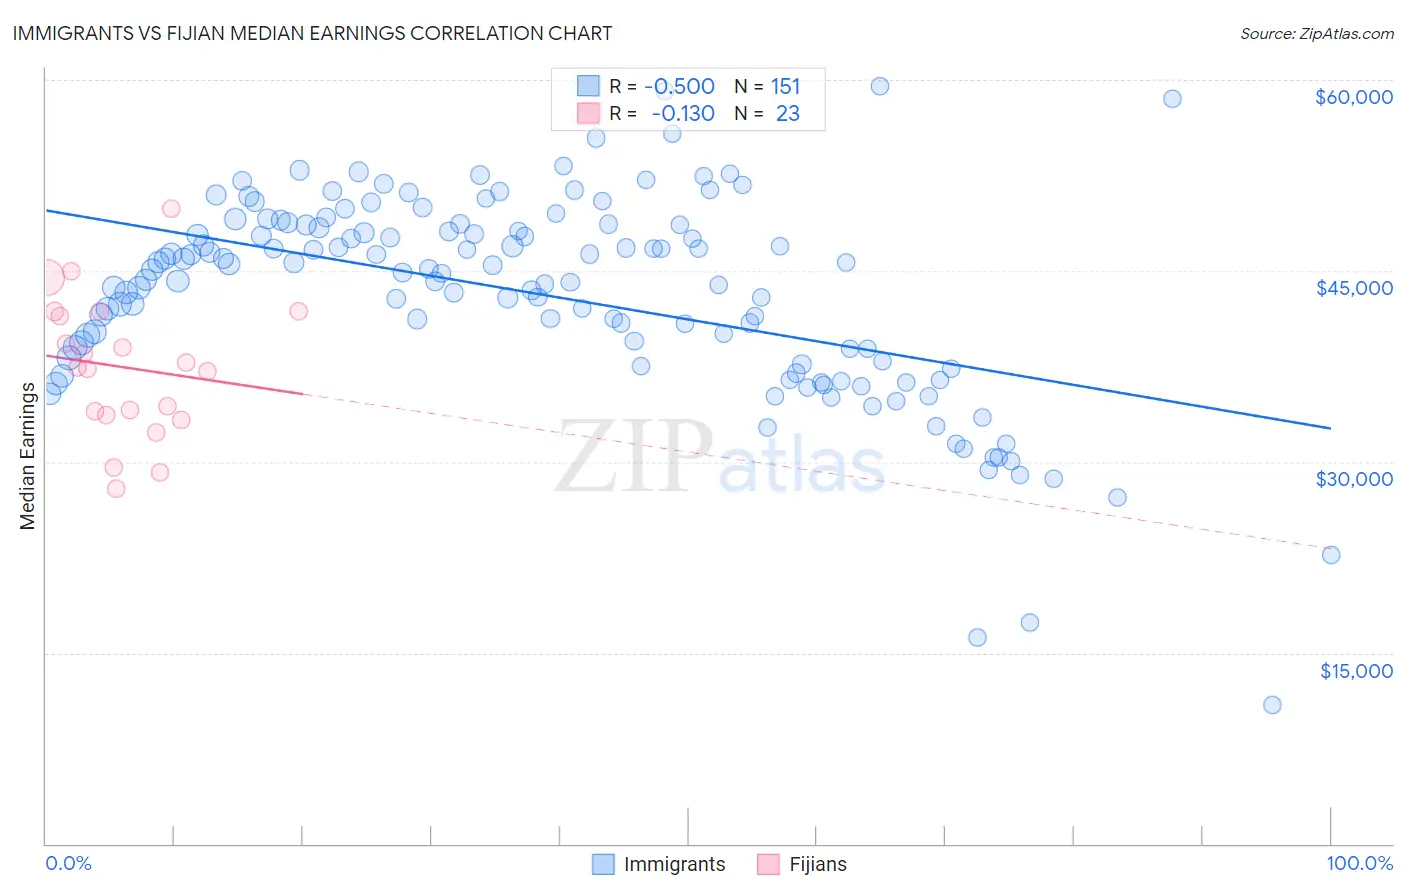
Immigrants vs Fijian Median Earnings Correlation Chart
The statistical analysis conducted on geographies consisting of 576,851,611 people shows a substantial negative correlation between the proportion of Immigrants and median earnings in the United States with a correlation coefficient (R) of -0.500 and weighted average of $46,478. Similarly, the statistical analysis conducted on geographies consisting of 55,947,867 people shows a poor negative correlation between the proportion of Fijians and median earnings in the United States with a correlation coefficient (R) of -0.130 and weighted average of $40,193, a difference of 15.6%.
Median Earnings Correlation Summary
| Measurement | Immigrants | Fijian |
| Minimum | $10,941 | $27,917 |
| Maximum | $59,517 | $49,875 |
| Range | $48,576 | $21,958 |
| Mean | $43,122 | $37,430 |
| Median | $44,875 | $37,445 |
| Interquartile 25% (IQ1) | $37,857 | $33,695 |
| Interquartile 75% (IQ3) | $48,614 | $41,805 |
| Interquartile Range (IQR) | $10,757 | $8,109 |
| Standard Deviation (Sample) | $8,036 | $5,451 |
| Standard Deviation (Population) | $8,009 | $5,331 |
Similar Demographics by Median Earnings
Demographics Similar to Immigrants by Median Earnings
In terms of median earnings, the demographic groups most similar to Immigrants are Scottish ($46,463, a difference of 0.030%), Kenyan ($46,462, a difference of 0.030%), Ghanaian ($46,440, a difference of 0.080%), Scandinavian ($46,433, a difference of 0.10%), and Immigrants from South America ($46,548, a difference of 0.15%).
| Demographics | Rating | Rank | Median Earnings |
| Icelanders | 66.3 /100 | #163 | Good $46,916 |
| Norwegians | 64.7 /100 | #164 | Good $46,865 |
| South Americans | 62.7 /100 | #165 | Good $46,804 |
| Czechoslovakians | 57.8 /100 | #166 | Average $46,658 |
| Costa Ricans | 57.4 /100 | #167 | Average $46,645 |
| Immigrants | Africa | 54.6 /100 | #168 | Average $46,564 |
| Immigrants | South America | 54.0 /100 | #169 | Average $46,548 |
| Immigrants | Immigrants | 51.6 /100 | #170 | Average $46,478 |
| Scottish | 51.1 /100 | #171 | Average $46,463 |
| Kenyans | 51.0 /100 | #172 | Average $46,462 |
| Ghanaians | 50.3 /100 | #173 | Average $46,440 |
| Scandinavians | 50.0 /100 | #174 | Average $46,433 |
| Basques | 48.8 /100 | #175 | Average $46,399 |
| Danes | 48.6 /100 | #176 | Average $46,392 |
| Belgians | 48.0 /100 | #177 | Average $46,375 |
Demographics Similar to Fijians by Median Earnings
In terms of median earnings, the demographic groups most similar to Fijians are Immigrants from Honduras ($40,195, a difference of 0.0%), Cheyenne ($40,233, a difference of 0.10%), Seminole ($40,233, a difference of 0.10%), Choctaw ($40,270, a difference of 0.19%), and Dutch West Indian ($40,107, a difference of 0.21%).
| Demographics | Rating | Rank | Median Earnings |
| Apache | 0.0 /100 | #310 | Tragic $40,388 |
| Hispanics or Latinos | 0.0 /100 | #311 | Tragic $40,288 |
| Chippewa | 0.0 /100 | #312 | Tragic $40,287 |
| Choctaw | 0.0 /100 | #313 | Tragic $40,270 |
| Cheyenne | 0.0 /100 | #314 | Tragic $40,233 |
| Seminole | 0.0 /100 | #315 | Tragic $40,233 |
| Immigrants | Honduras | 0.0 /100 | #316 | Tragic $40,195 |
| Fijians | 0.0 /100 | #317 | Tragic $40,193 |
| Dutch West Indians | 0.0 /100 | #318 | Tragic $40,107 |
| Blacks/African Americans | 0.0 /100 | #319 | Tragic $40,085 |
| Immigrants | Bahamas | 0.0 /100 | #320 | Tragic $39,861 |
| Mexicans | 0.0 /100 | #321 | Tragic $39,834 |
| Immigrants | Central America | 0.0 /100 | #322 | Tragic $39,762 |
| Bahamians | 0.0 /100 | #323 | Tragic $39,735 |
| Ottawa | 0.0 /100 | #324 | Tragic $39,721 |