Immigrants from Uzbekistan vs Salvadoran Median Household Income
COMPARE
Immigrants from Uzbekistan
Salvadoran
Median Household Income
Median Household Income Comparison
Immigrants from Uzbekistan
Salvadorans
$86,425
MEDIAN HOUSEHOLD INCOME
70.1/ 100
METRIC RATING
159th/ 347
METRIC RANK
$82,449
MEDIAN HOUSEHOLD INCOME
15.4/ 100
METRIC RATING
211th/ 347
METRIC RANK
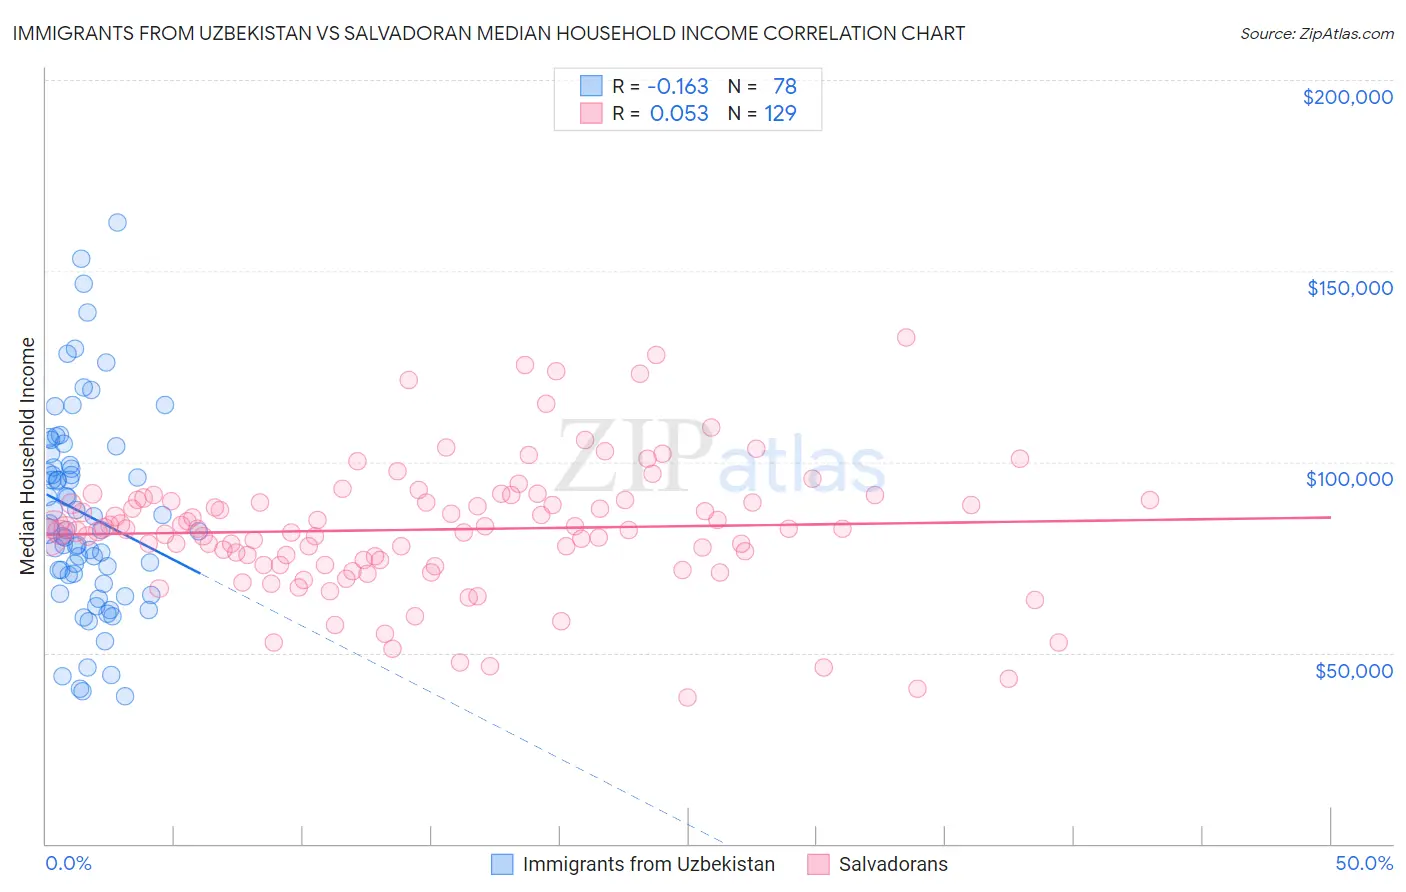
Immigrants from Uzbekistan vs Salvadoran Median Household Income Correlation Chart
The statistical analysis conducted on geographies consisting of 118,697,926 people shows a poor negative correlation between the proportion of Immigrants from Uzbekistan and median household income in the United States with a correlation coefficient (R) of -0.163 and weighted average of $86,425. Similarly, the statistical analysis conducted on geographies consisting of 398,609,851 people shows a slight positive correlation between the proportion of Salvadorans and median household income in the United States with a correlation coefficient (R) of 0.053 and weighted average of $82,449, a difference of 4.8%.
Median Household Income Correlation Summary
| Measurement | Immigrants from Uzbekistan | Salvadoran |
| Minimum | $38,670 | $38,281 |
| Maximum | $162,808 | $132,625 |
| Range | $124,138 | $94,344 |
| Mean | $86,352 | $82,302 |
| Median | $82,168 | $82,350 |
| Interquartile 25% (IQ1) | $70,322 | $73,617 |
| Interquartile 75% (IQ3) | $99,228 | $90,029 |
| Interquartile Range (IQR) | $28,906 | $16,412 |
| Standard Deviation (Sample) | $26,082 | $17,071 |
| Standard Deviation (Population) | $25,914 | $17,005 |
Similar Demographics by Median Household Income
Demographics Similar to Immigrants from Uzbekistan by Median Household Income
In terms of median household income, the demographic groups most similar to Immigrants from Uzbekistan are Luxembourger ($86,418, a difference of 0.010%), Slavic ($86,398, a difference of 0.030%), Moroccan ($86,468, a difference of 0.050%), Samoan ($86,498, a difference of 0.080%), and Immigrants from Albania ($86,534, a difference of 0.13%).
| Demographics | Rating | Rank | Median Household Income |
| Immigrants | Saudi Arabia | 75.8 /100 | #152 | Good $86,875 |
| South Americans | 75.1 /100 | #153 | Good $86,824 |
| Immigrants | Germany | 74.4 /100 | #154 | Good $86,764 |
| Carpatho Rusyns | 72.8 /100 | #155 | Good $86,635 |
| Immigrants | Albania | 71.5 /100 | #156 | Good $86,534 |
| Samoans | 71.0 /100 | #157 | Good $86,498 |
| Moroccans | 70.6 /100 | #158 | Good $86,468 |
| Immigrants | Uzbekistan | 70.1 /100 | #159 | Good $86,425 |
| Luxembourgers | 70.0 /100 | #160 | Good $86,418 |
| Slavs | 69.7 /100 | #161 | Good $86,398 |
| Guamanians/Chamorros | 67.7 /100 | #162 | Good $86,255 |
| Czechs | 66.4 /100 | #163 | Good $86,164 |
| Irish | 66.2 /100 | #164 | Good $86,145 |
| Norwegians | 65.3 /100 | #165 | Good $86,084 |
| Scandinavians | 65.1 /100 | #166 | Good $86,073 |
Demographics Similar to Salvadorans by Median Household Income
In terms of median household income, the demographic groups most similar to Salvadorans are Venezuelan ($82,432, a difference of 0.020%), Nepalese ($82,410, a difference of 0.050%), Immigrants from Uruguay ($82,560, a difference of 0.14%), Immigrants from Iraq ($82,594, a difference of 0.18%), and Panamanian ($82,272, a difference of 0.22%).
| Demographics | Rating | Rank | Median Household Income |
| Immigrants | Africa | 23.8 /100 | #204 | Fair $83,289 |
| Celtics | 22.7 /100 | #205 | Fair $83,193 |
| Immigrants | Kenya | 21.3 /100 | #206 | Fair $83,068 |
| Dutch | 20.3 /100 | #207 | Fair $82,971 |
| French Canadians | 18.7 /100 | #208 | Poor $82,810 |
| Immigrants | Iraq | 16.7 /100 | #209 | Poor $82,594 |
| Immigrants | Uruguay | 16.4 /100 | #210 | Poor $82,560 |
| Salvadorans | 15.4 /100 | #211 | Poor $82,449 |
| Venezuelans | 15.3 /100 | #212 | Poor $82,432 |
| Nepalese | 15.1 /100 | #213 | Poor $82,410 |
| Panamanians | 14.0 /100 | #214 | Poor $82,272 |
| Vietnamese | 13.8 /100 | #215 | Poor $82,248 |
| Yugoslavians | 13.3 /100 | #216 | Poor $82,186 |
| Ecuadorians | 12.5 /100 | #217 | Poor $82,070 |
| Whites/Caucasians | 12.2 /100 | #218 | Poor $82,029 |