Immigrants from Uzbekistan vs French Median Household Income
COMPARE
Immigrants from Uzbekistan
French
Median Household Income
Median Household Income Comparison
Immigrants from Uzbekistan
French
$86,425
MEDIAN HOUSEHOLD INCOME
70.1/ 100
METRIC RATING
159th/ 347
METRIC RANK
$83,468
MEDIAN HOUSEHOLD INCOME
26.0/ 100
METRIC RATING
196th/ 347
METRIC RANK
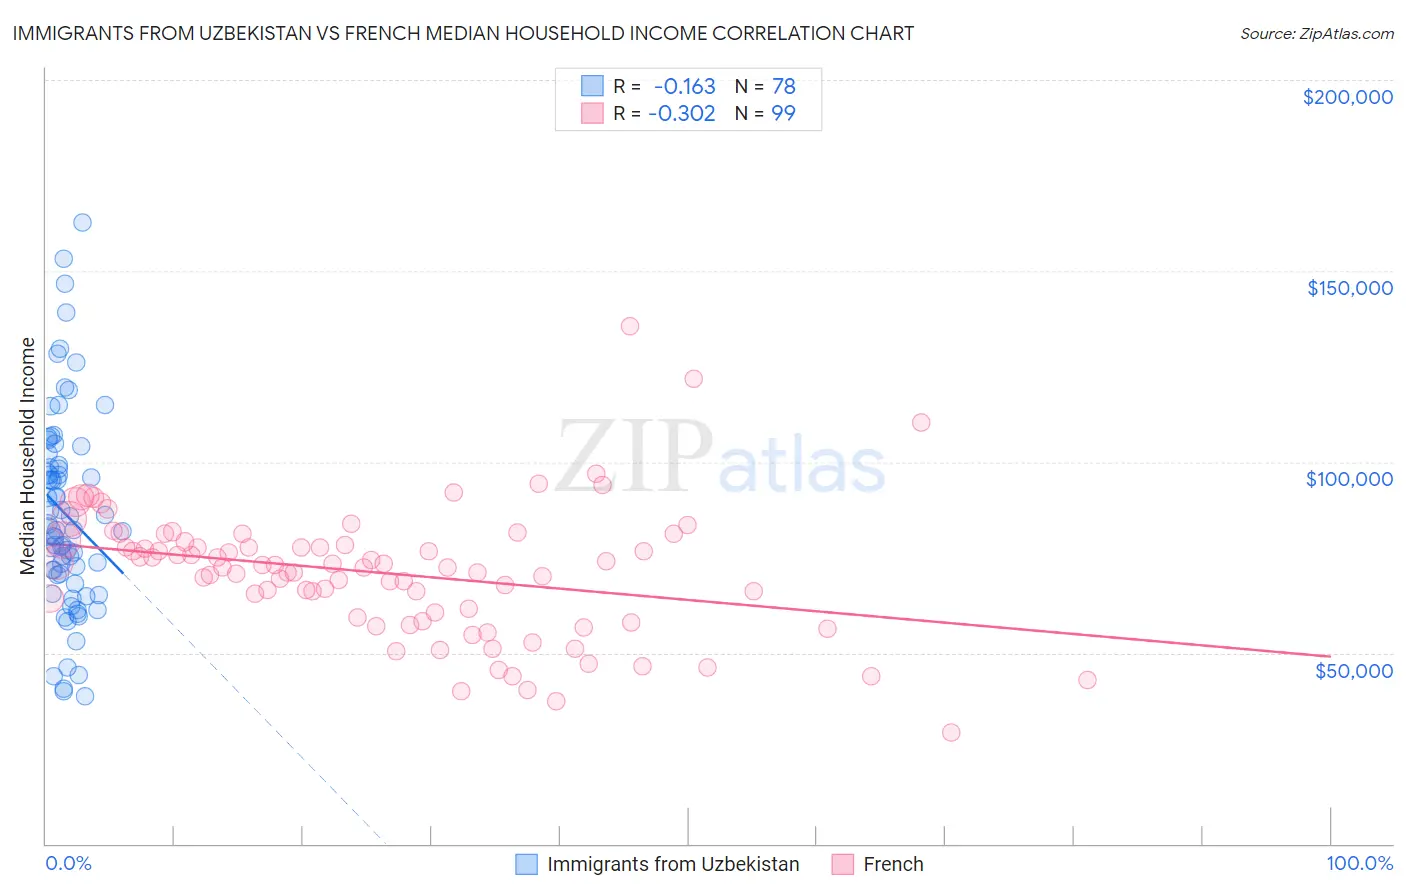
Immigrants from Uzbekistan vs French Median Household Income Correlation Chart
The statistical analysis conducted on geographies consisting of 118,697,926 people shows a poor negative correlation between the proportion of Immigrants from Uzbekistan and median household income in the United States with a correlation coefficient (R) of -0.163 and weighted average of $86,425. Similarly, the statistical analysis conducted on geographies consisting of 571,286,063 people shows a mild negative correlation between the proportion of French and median household income in the United States with a correlation coefficient (R) of -0.302 and weighted average of $83,468, a difference of 3.5%.
Median Household Income Correlation Summary
| Measurement | Immigrants from Uzbekistan | French |
| Minimum | $38,670 | $29,263 |
| Maximum | $162,808 | $135,625 |
| Range | $124,138 | $106,362 |
| Mean | $86,352 | $70,877 |
| Median | $82,168 | $72,372 |
| Interquartile 25% (IQ1) | $70,322 | $59,090 |
| Interquartile 75% (IQ3) | $99,228 | $79,064 |
| Interquartile Range (IQR) | $28,906 | $19,974 |
| Standard Deviation (Sample) | $26,082 | $17,004 |
| Standard Deviation (Population) | $25,914 | $16,918 |
Similar Demographics by Median Household Income
Demographics Similar to Immigrants from Uzbekistan by Median Household Income
In terms of median household income, the demographic groups most similar to Immigrants from Uzbekistan are Luxembourger ($86,418, a difference of 0.010%), Slavic ($86,398, a difference of 0.030%), Moroccan ($86,468, a difference of 0.050%), Samoan ($86,498, a difference of 0.080%), and Immigrants from Albania ($86,534, a difference of 0.13%).
| Demographics | Rating | Rank | Median Household Income |
| Immigrants | Saudi Arabia | 75.8 /100 | #152 | Good $86,875 |
| South Americans | 75.1 /100 | #153 | Good $86,824 |
| Immigrants | Germany | 74.4 /100 | #154 | Good $86,764 |
| Carpatho Rusyns | 72.8 /100 | #155 | Good $86,635 |
| Immigrants | Albania | 71.5 /100 | #156 | Good $86,534 |
| Samoans | 71.0 /100 | #157 | Good $86,498 |
| Moroccans | 70.6 /100 | #158 | Good $86,468 |
| Immigrants | Uzbekistan | 70.1 /100 | #159 | Good $86,425 |
| Luxembourgers | 70.0 /100 | #160 | Good $86,418 |
| Slavs | 69.7 /100 | #161 | Good $86,398 |
| Guamanians/Chamorros | 67.7 /100 | #162 | Good $86,255 |
| Czechs | 66.4 /100 | #163 | Good $86,164 |
| Irish | 66.2 /100 | #164 | Good $86,145 |
| Norwegians | 65.3 /100 | #165 | Good $86,084 |
| Scandinavians | 65.1 /100 | #166 | Good $86,073 |
Demographics Similar to French by Median Household Income
In terms of median household income, the demographic groups most similar to French are Aleut ($83,446, a difference of 0.030%), Japanese ($83,395, a difference of 0.090%), Immigrants from Armenia ($83,555, a difference of 0.10%), German ($83,358, a difference of 0.13%), and Ghanaian ($83,582, a difference of 0.14%).
| Demographics | Rating | Rank | Median Household Income |
| Immigrants | Colombia | 31.7 /100 | #189 | Fair $83,902 |
| Slovaks | 30.2 /100 | #190 | Fair $83,798 |
| Iraqis | 29.6 /100 | #191 | Fair $83,753 |
| Welsh | 28.0 /100 | #192 | Fair $83,628 |
| Finns | 27.7 /100 | #193 | Fair $83,607 |
| Ghanaians | 27.4 /100 | #194 | Fair $83,582 |
| Immigrants | Armenia | 27.0 /100 | #195 | Fair $83,555 |
| French | 26.0 /100 | #196 | Fair $83,468 |
| Aleuts | 25.7 /100 | #197 | Fair $83,446 |
| Japanese | 25.1 /100 | #198 | Fair $83,395 |
| Germans | 24.6 /100 | #199 | Fair $83,358 |
| Tsimshian | 24.5 /100 | #200 | Fair $83,346 |
| Spanish | 24.4 /100 | #201 | Fair $83,343 |
| Immigrants | Thailand | 24.3 /100 | #202 | Fair $83,327 |
| Immigrants | Cambodia | 24.0 /100 | #203 | Fair $83,304 |