Immigrants from Uruguay vs Inupiat Median Earnings
COMPARE
Immigrants from Uruguay
Inupiat
Median Earnings
Median Earnings Comparison
Immigrants from Uruguay
Inupiat
$45,682
MEDIAN EARNINGS
25.9/ 100
METRIC RATING
204th/ 347
METRIC RANK
$43,000
MEDIAN EARNINGS
0.8/ 100
METRIC RATING
263rd/ 347
METRIC RANK
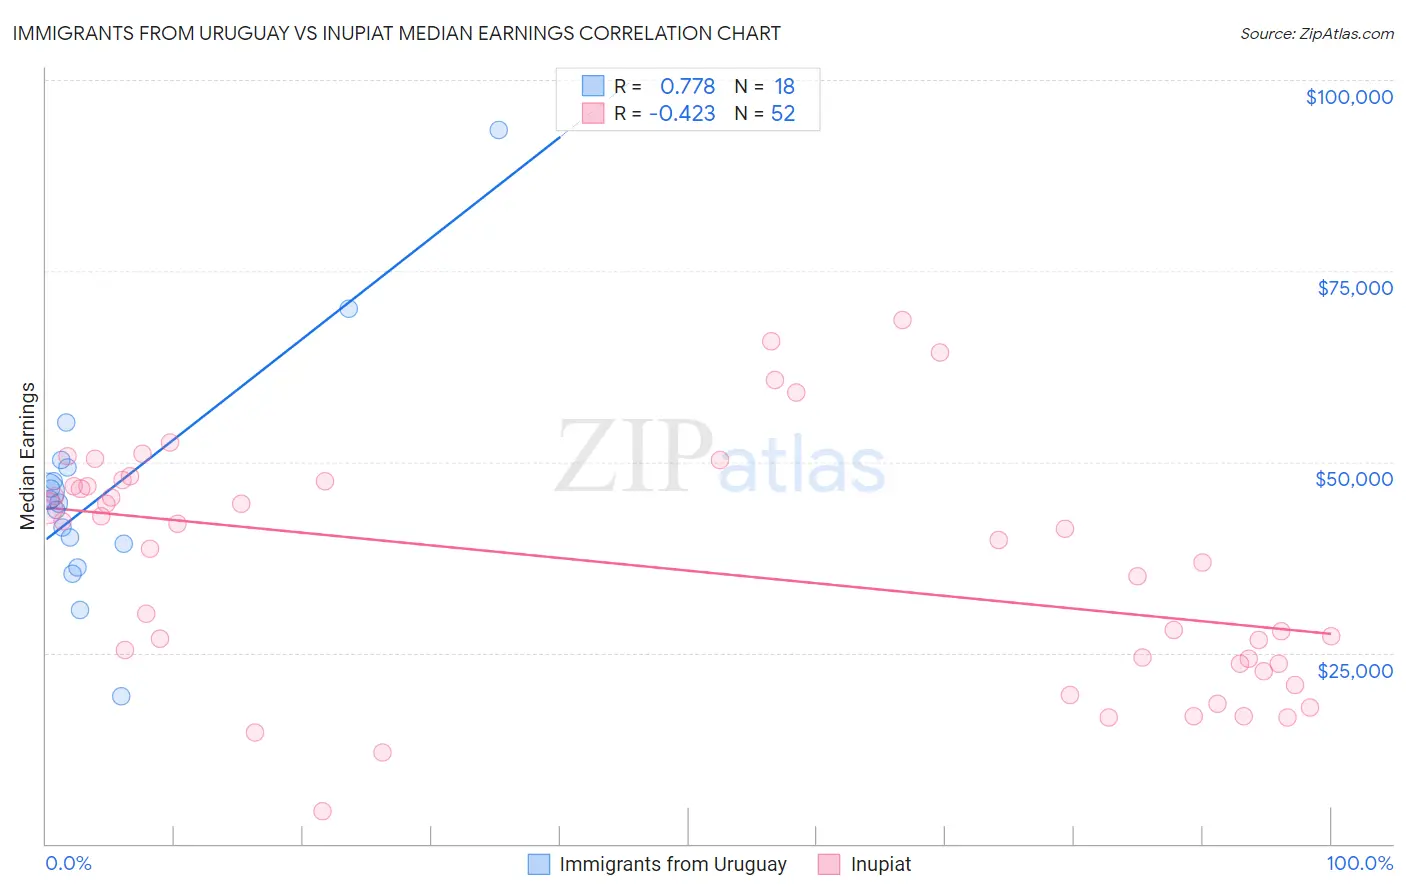
Immigrants from Uruguay vs Inupiat Median Earnings Correlation Chart
The statistical analysis conducted on geographies consisting of 133,259,667 people shows a strong positive correlation between the proportion of Immigrants from Uruguay and median earnings in the United States with a correlation coefficient (R) of 0.778 and weighted average of $45,682. Similarly, the statistical analysis conducted on geographies consisting of 96,339,660 people shows a moderate negative correlation between the proportion of Inupiat and median earnings in the United States with a correlation coefficient (R) of -0.423 and weighted average of $43,000, a difference of 6.2%.
Median Earnings Correlation Summary
| Measurement | Immigrants from Uruguay | Inupiat |
| Minimum | $19,375 | $4,192 |
| Maximum | $93,387 | $68,590 |
| Range | $74,012 | $64,398 |
| Mean | $46,310 | $36,209 |
| Median | $44,791 | $39,208 |
| Interquartile 25% (IQ1) | $39,250 | $23,611 |
| Interquartile 75% (IQ3) | $49,312 | $47,170 |
| Interquartile Range (IQR) | $10,062 | $23,559 |
| Standard Deviation (Sample) | $15,725 | $15,551 |
| Standard Deviation (Population) | $15,282 | $15,401 |
Similar Demographics by Median Earnings
Demographics Similar to Immigrants from Uruguay by Median Earnings
In terms of median earnings, the demographic groups most similar to Immigrants from Uruguay are Tongan ($45,665, a difference of 0.040%), Welsh ($45,710, a difference of 0.060%), Immigrants from Ghana ($45,641, a difference of 0.090%), Immigrants from Trinidad and Tobago ($45,729, a difference of 0.10%), and Celtic ($45,732, a difference of 0.11%).
| Demographics | Rating | Rank | Median Earnings |
| Barbadians | 30.5 /100 | #197 | Fair $45,846 |
| Trinidadians and Tobagonians | 29.7 /100 | #198 | Fair $45,820 |
| Immigrants | Barbados | 29.6 /100 | #199 | Fair $45,816 |
| Immigrants | Azores | 29.5 /100 | #200 | Fair $45,812 |
| Celtics | 27.2 /100 | #201 | Fair $45,732 |
| Immigrants | Trinidad and Tobago | 27.1 /100 | #202 | Fair $45,729 |
| Welsh | 26.6 /100 | #203 | Fair $45,710 |
| Immigrants | Uruguay | 25.9 /100 | #204 | Fair $45,682 |
| Tongans | 25.4 /100 | #205 | Fair $45,665 |
| Immigrants | Ghana | 24.8 /100 | #206 | Fair $45,641 |
| Immigrants | Senegal | 24.0 /100 | #207 | Fair $45,611 |
| Immigrants | Bosnia and Herzegovina | 23.7 /100 | #208 | Fair $45,600 |
| Immigrants | Thailand | 23.7 /100 | #209 | Fair $45,598 |
| Immigrants | Grenada | 23.6 /100 | #210 | Fair $45,596 |
| Panamanians | 23.5 /100 | #211 | Fair $45,593 |
Demographics Similar to Inupiat by Median Earnings
In terms of median earnings, the demographic groups most similar to Inupiat are Immigrants from Jamaica ($43,026, a difference of 0.060%), Nicaraguan ($43,026, a difference of 0.060%), Immigrants from Liberia ($42,923, a difference of 0.18%), Salvadoran ($42,912, a difference of 0.20%), and Immigrants from Somalia ($43,100, a difference of 0.23%).
| Demographics | Rating | Rank | Median Earnings |
| Alaskan Athabascans | 1.4 /100 | #256 | Tragic $43,393 |
| Jamaicans | 1.3 /100 | #257 | Tragic $43,343 |
| French American Indians | 1.3 /100 | #258 | Tragic $43,333 |
| German Russians | 1.1 /100 | #259 | Tragic $43,200 |
| Immigrants | Somalia | 0.9 /100 | #260 | Tragic $43,100 |
| Immigrants | Jamaica | 0.8 /100 | #261 | Tragic $43,026 |
| Nicaraguans | 0.8 /100 | #262 | Tragic $43,026 |
| Inupiat | 0.8 /100 | #263 | Tragic $43,000 |
| Immigrants | Liberia | 0.7 /100 | #264 | Tragic $42,923 |
| Salvadorans | 0.7 /100 | #265 | Tragic $42,912 |
| Immigrants | Laos | 0.7 /100 | #266 | Tragic $42,884 |
| Cree | 0.6 /100 | #267 | Tragic $42,777 |
| Americans | 0.6 /100 | #268 | Tragic $42,742 |
| Belizeans | 0.5 /100 | #269 | Tragic $42,702 |
| Osage | 0.5 /100 | #270 | Tragic $42,651 |