Immigrants from Belarus vs Inupiat Median Earnings
COMPARE
Immigrants from Belarus
Inupiat
Median Earnings
Median Earnings Comparison
Immigrants from Belarus
Inupiat
$53,043
MEDIAN EARNINGS
100.0/ 100
METRIC RATING
37th/ 347
METRIC RANK
$43,000
MEDIAN EARNINGS
0.8/ 100
METRIC RATING
263rd/ 347
METRIC RANK
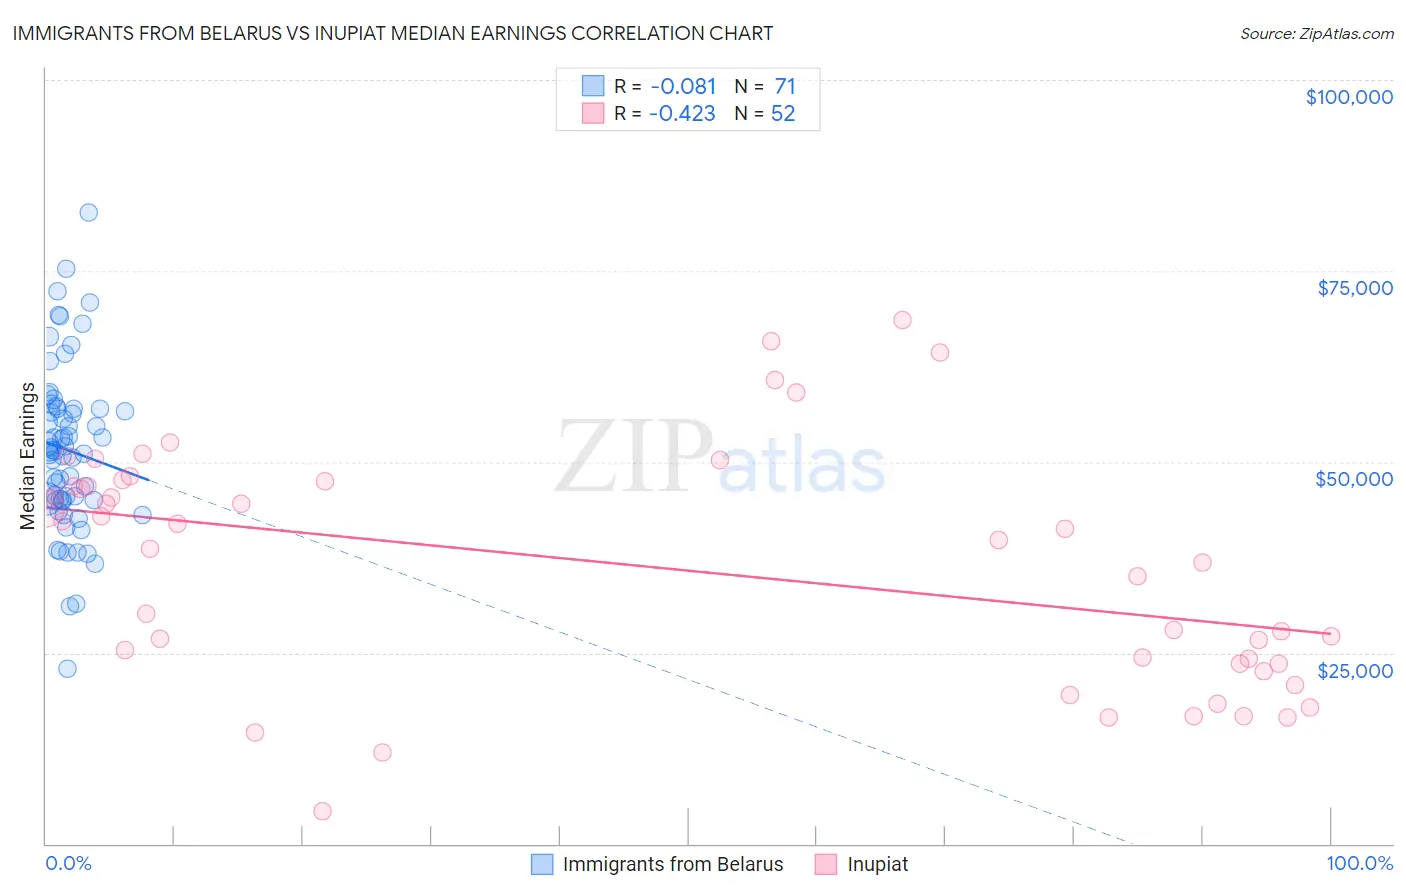
Immigrants from Belarus vs Inupiat Median Earnings Correlation Chart
The statistical analysis conducted on geographies consisting of 150,193,045 people shows a slight negative correlation between the proportion of Immigrants from Belarus and median earnings in the United States with a correlation coefficient (R) of -0.081 and weighted average of $53,043. Similarly, the statistical analysis conducted on geographies consisting of 96,339,660 people shows a moderate negative correlation between the proportion of Inupiat and median earnings in the United States with a correlation coefficient (R) of -0.423 and weighted average of $43,000, a difference of 23.4%.
Median Earnings Correlation Summary
| Measurement | Immigrants from Belarus | Inupiat |
| Minimum | $22,866 | $4,192 |
| Maximum | $82,699 | $68,590 |
| Range | $59,833 | $64,398 |
| Mean | $51,554 | $36,209 |
| Median | $51,310 | $39,208 |
| Interquartile 25% (IQ1) | $45,000 | $23,611 |
| Interquartile 75% (IQ3) | $56,946 | $47,170 |
| Interquartile Range (IQR) | $11,946 | $23,559 |
| Standard Deviation (Sample) | $10,748 | $15,551 |
| Standard Deviation (Population) | $10,672 | $15,401 |
Similar Demographics by Median Earnings
Demographics Similar to Immigrants from Belarus by Median Earnings
In terms of median earnings, the demographic groups most similar to Immigrants from Belarus are Latvian ($53,001, a difference of 0.080%), Immigrants from Turkey ($52,960, a difference of 0.16%), Israeli ($52,937, a difference of 0.20%), Immigrants from Denmark ($53,186, a difference of 0.27%), and Immigrants from Switzerland ($53,211, a difference of 0.32%).
| Demographics | Rating | Rank | Median Earnings |
| Cambodians | 100.0 /100 | #30 | Exceptional $53,386 |
| Russians | 100.0 /100 | #31 | Exceptional $53,334 |
| Immigrants | Asia | 100.0 /100 | #32 | Exceptional $53,310 |
| Immigrants | Greece | 100.0 /100 | #33 | Exceptional $53,282 |
| Immigrants | Sri Lanka | 100.0 /100 | #34 | Exceptional $53,268 |
| Immigrants | Switzerland | 100.0 /100 | #35 | Exceptional $53,211 |
| Immigrants | Denmark | 100.0 /100 | #36 | Exceptional $53,186 |
| Immigrants | Belarus | 100.0 /100 | #37 | Exceptional $53,043 |
| Latvians | 100.0 /100 | #38 | Exceptional $53,001 |
| Immigrants | Turkey | 100.0 /100 | #39 | Exceptional $52,960 |
| Israelis | 100.0 /100 | #40 | Exceptional $52,937 |
| Immigrants | Lithuania | 100.0 /100 | #41 | Exceptional $52,769 |
| Maltese | 100.0 /100 | #42 | Exceptional $52,526 |
| Immigrants | Malaysia | 100.0 /100 | #43 | Exceptional $52,514 |
| Bulgarians | 100.0 /100 | #44 | Exceptional $52,512 |
Demographics Similar to Inupiat by Median Earnings
In terms of median earnings, the demographic groups most similar to Inupiat are Immigrants from Jamaica ($43,026, a difference of 0.060%), Nicaraguan ($43,026, a difference of 0.060%), Immigrants from Liberia ($42,923, a difference of 0.18%), Salvadoran ($42,912, a difference of 0.20%), and Immigrants from Somalia ($43,100, a difference of 0.23%).
| Demographics | Rating | Rank | Median Earnings |
| Alaskan Athabascans | 1.4 /100 | #256 | Tragic $43,393 |
| Jamaicans | 1.3 /100 | #257 | Tragic $43,343 |
| French American Indians | 1.3 /100 | #258 | Tragic $43,333 |
| German Russians | 1.1 /100 | #259 | Tragic $43,200 |
| Immigrants | Somalia | 0.9 /100 | #260 | Tragic $43,100 |
| Immigrants | Jamaica | 0.8 /100 | #261 | Tragic $43,026 |
| Nicaraguans | 0.8 /100 | #262 | Tragic $43,026 |
| Inupiat | 0.8 /100 | #263 | Tragic $43,000 |
| Immigrants | Liberia | 0.7 /100 | #264 | Tragic $42,923 |
| Salvadorans | 0.7 /100 | #265 | Tragic $42,912 |
| Immigrants | Laos | 0.7 /100 | #266 | Tragic $42,884 |
| Cree | 0.6 /100 | #267 | Tragic $42,777 |
| Americans | 0.6 /100 | #268 | Tragic $42,742 |
| Belizeans | 0.5 /100 | #269 | Tragic $42,702 |
| Osage | 0.5 /100 | #270 | Tragic $42,651 |