Immigrants from Uruguay vs Hungarian Median Earnings
COMPARE
Immigrants from Uruguay
Hungarian
Median Earnings
Median Earnings Comparison
Immigrants from Uruguay
Hungarians
$45,682
MEDIAN EARNINGS
25.9/ 100
METRIC RATING
204th/ 347
METRIC RANK
$47,795
MEDIAN EARNINGS
87.1/ 100
METRIC RATING
144th/ 347
METRIC RANK
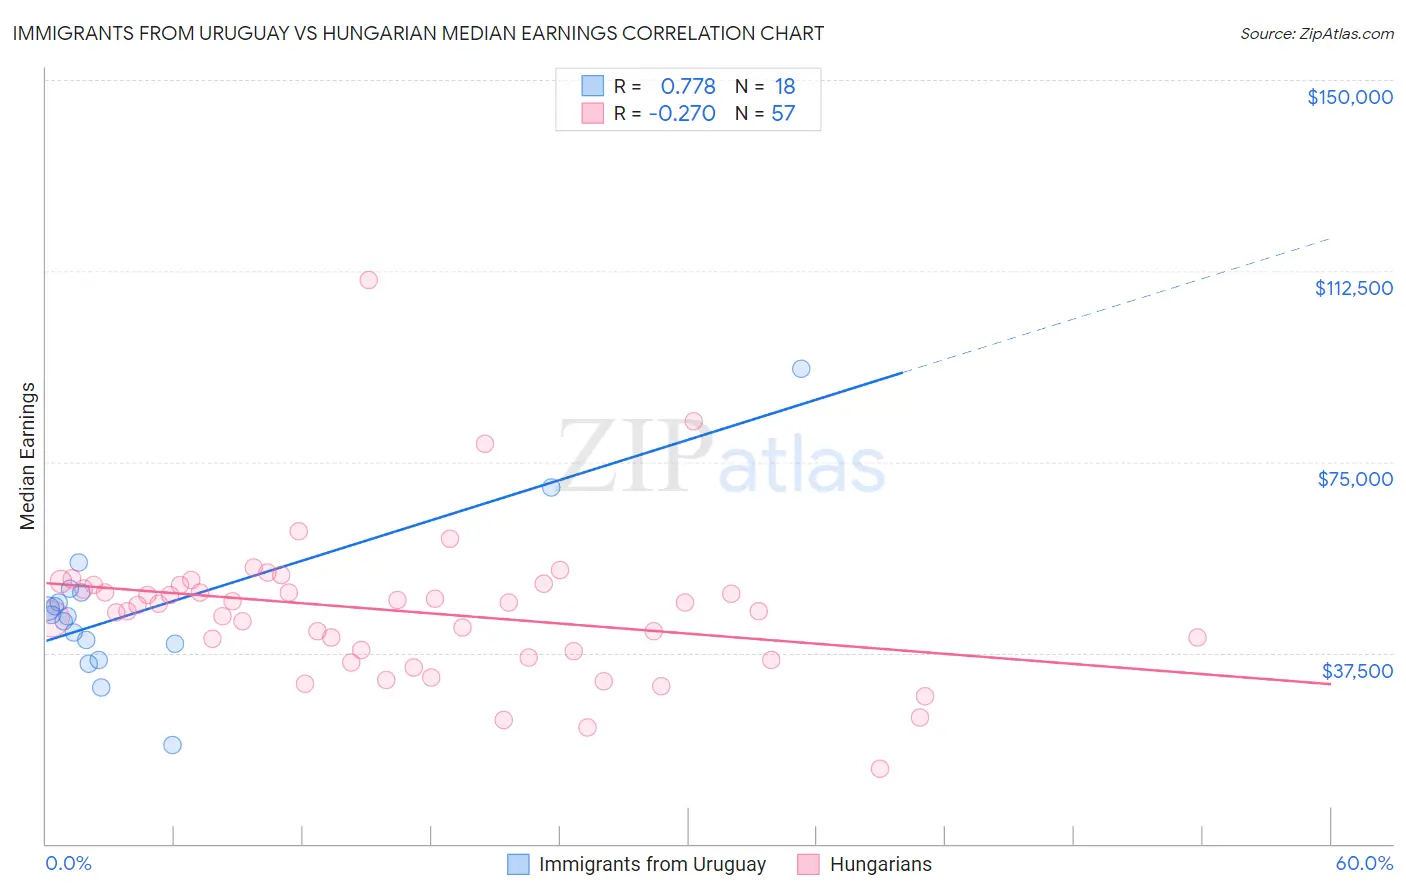
Immigrants from Uruguay vs Hungarian Median Earnings Correlation Chart
The statistical analysis conducted on geographies consisting of 133,259,667 people shows a strong positive correlation between the proportion of Immigrants from Uruguay and median earnings in the United States with a correlation coefficient (R) of 0.778 and weighted average of $45,682. Similarly, the statistical analysis conducted on geographies consisting of 486,158,969 people shows a weak negative correlation between the proportion of Hungarians and median earnings in the United States with a correlation coefficient (R) of -0.270 and weighted average of $47,795, a difference of 4.6%.
Median Earnings Correlation Summary
| Measurement | Immigrants from Uruguay | Hungarian |
| Minimum | $19,375 | $14,721 |
| Maximum | $93,387 | $110,790 |
| Range | $74,012 | $96,069 |
| Mean | $46,310 | $45,677 |
| Median | $44,791 | $46,823 |
| Interquartile 25% (IQ1) | $39,250 | $37,180 |
| Interquartile 75% (IQ3) | $49,312 | $50,813 |
| Interquartile Range (IQR) | $10,062 | $13,633 |
| Standard Deviation (Sample) | $15,725 | $14,634 |
| Standard Deviation (Population) | $15,282 | $14,505 |
Similar Demographics by Median Earnings
Demographics Similar to Immigrants from Uruguay by Median Earnings
In terms of median earnings, the demographic groups most similar to Immigrants from Uruguay are Tongan ($45,665, a difference of 0.040%), Welsh ($45,710, a difference of 0.060%), Immigrants from Ghana ($45,641, a difference of 0.090%), Immigrants from Trinidad and Tobago ($45,729, a difference of 0.10%), and Celtic ($45,732, a difference of 0.11%).
| Demographics | Rating | Rank | Median Earnings |
| Barbadians | 30.5 /100 | #197 | Fair $45,846 |
| Trinidadians and Tobagonians | 29.7 /100 | #198 | Fair $45,820 |
| Immigrants | Barbados | 29.6 /100 | #199 | Fair $45,816 |
| Immigrants | Azores | 29.5 /100 | #200 | Fair $45,812 |
| Celtics | 27.2 /100 | #201 | Fair $45,732 |
| Immigrants | Trinidad and Tobago | 27.1 /100 | #202 | Fair $45,729 |
| Welsh | 26.6 /100 | #203 | Fair $45,710 |
| Immigrants | Uruguay | 25.9 /100 | #204 | Fair $45,682 |
| Tongans | 25.4 /100 | #205 | Fair $45,665 |
| Immigrants | Ghana | 24.8 /100 | #206 | Fair $45,641 |
| Immigrants | Senegal | 24.0 /100 | #207 | Fair $45,611 |
| Immigrants | Bosnia and Herzegovina | 23.7 /100 | #208 | Fair $45,600 |
| Immigrants | Thailand | 23.7 /100 | #209 | Fair $45,598 |
| Immigrants | Grenada | 23.6 /100 | #210 | Fair $45,596 |
| Panamanians | 23.5 /100 | #211 | Fair $45,593 |
Demographics Similar to Hungarians by Median Earnings
In terms of median earnings, the demographic groups most similar to Hungarians are Ugandan ($47,854, a difference of 0.12%), Swedish ($47,851, a difference of 0.12%), Immigrants from Sierra Leone ($47,875, a difference of 0.17%), Immigrants from Saudi Arabia ($47,704, a difference of 0.19%), and Immigrants from Chile ($47,697, a difference of 0.21%).
| Demographics | Rating | Rank | Median Earnings |
| Immigrants | Nepal | 89.0 /100 | #137 | Excellent $47,925 |
| Europeans | 88.9 /100 | #138 | Excellent $47,915 |
| Canadians | 88.8 /100 | #139 | Excellent $47,911 |
| Taiwanese | 88.7 /100 | #140 | Excellent $47,902 |
| Immigrants | Sierra Leone | 88.3 /100 | #141 | Excellent $47,875 |
| Ugandans | 88.0 /100 | #142 | Excellent $47,854 |
| Swedes | 88.0 /100 | #143 | Excellent $47,851 |
| Hungarians | 87.1 /100 | #144 | Excellent $47,795 |
| Immigrants | Saudi Arabia | 85.6 /100 | #145 | Excellent $47,704 |
| Immigrants | Chile | 85.5 /100 | #146 | Excellent $47,697 |
| Immigrants | South Eastern Asia | 85.0 /100 | #147 | Excellent $47,671 |
| Immigrants | Eritrea | 84.8 /100 | #148 | Excellent $47,657 |
| Luxembourgers | 84.5 /100 | #149 | Excellent $47,640 |
| Peruvians | 84.2 /100 | #150 | Excellent $47,628 |
| Immigrants | Oceania | 84.1 /100 | #151 | Excellent $47,617 |