Immigrants from Uruguay vs Ute Median Earnings
COMPARE
Immigrants from Uruguay
Ute
Median Earnings
Median Earnings Comparison
Immigrants from Uruguay
Ute
$45,682
MEDIAN EARNINGS
25.9/ 100
METRIC RATING
204th/ 347
METRIC RANK
$41,051
MEDIAN EARNINGS
0.1/ 100
METRIC RATING
300th/ 347
METRIC RANK
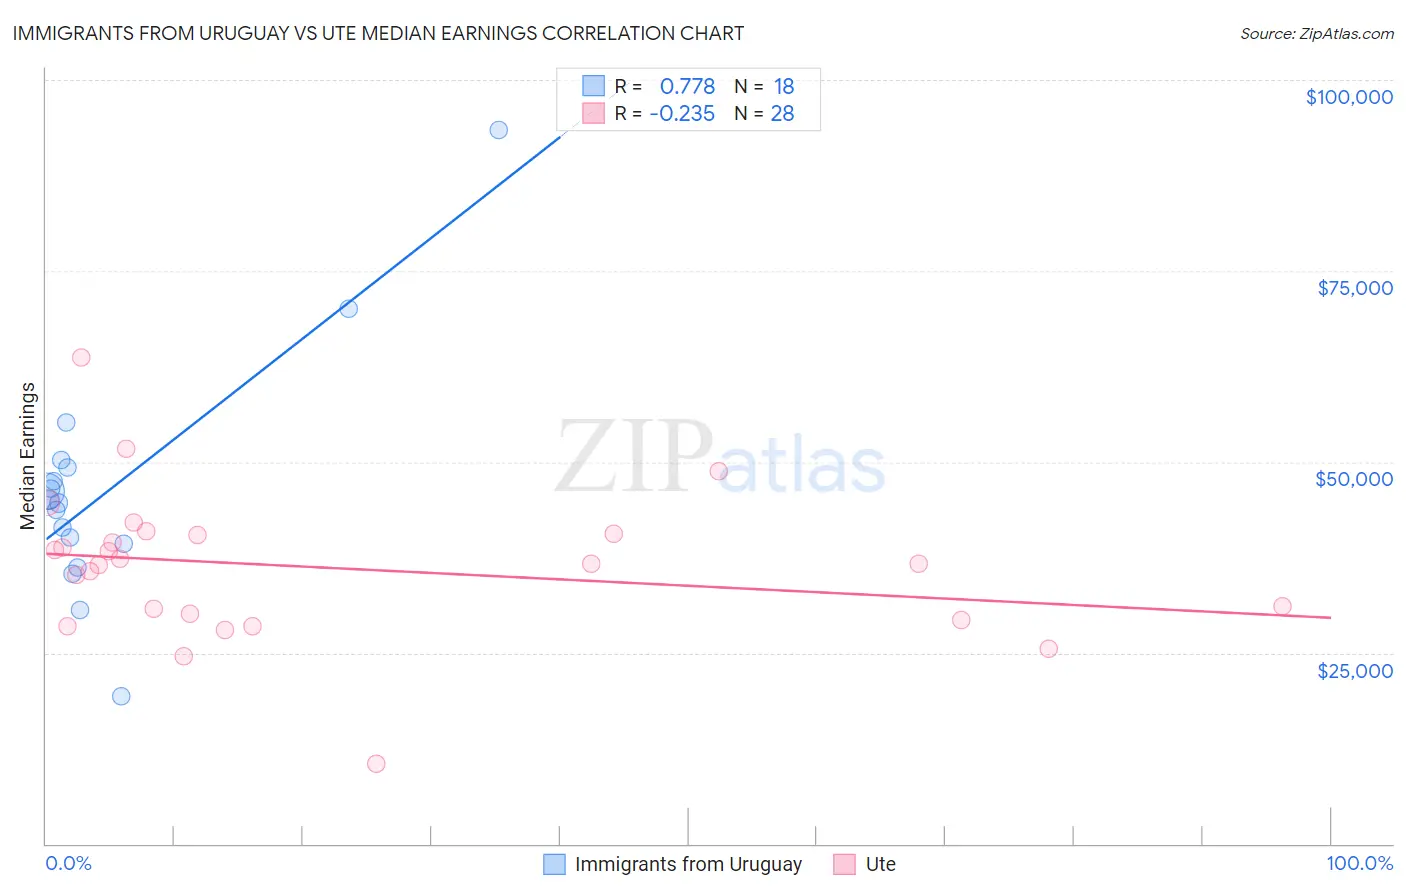
Immigrants from Uruguay vs Ute Median Earnings Correlation Chart
The statistical analysis conducted on geographies consisting of 133,259,667 people shows a strong positive correlation between the proportion of Immigrants from Uruguay and median earnings in the United States with a correlation coefficient (R) of 0.778 and weighted average of $45,682. Similarly, the statistical analysis conducted on geographies consisting of 55,664,253 people shows a weak negative correlation between the proportion of Ute and median earnings in the United States with a correlation coefficient (R) of -0.235 and weighted average of $41,051, a difference of 11.3%.
Median Earnings Correlation Summary
| Measurement | Immigrants from Uruguay | Ute |
| Minimum | $19,375 | $10,500 |
| Maximum | $93,387 | $63,719 |
| Range | $74,012 | $53,219 |
| Mean | $46,310 | $36,165 |
| Median | $44,791 | $36,686 |
| Interquartile 25% (IQ1) | $39,250 | $29,690 |
| Interquartile 75% (IQ3) | $49,312 | $40,497 |
| Interquartile Range (IQR) | $10,062 | $10,807 |
| Standard Deviation (Sample) | $15,725 | $9,794 |
| Standard Deviation (Population) | $15,282 | $9,618 |
Similar Demographics by Median Earnings
Demographics Similar to Immigrants from Uruguay by Median Earnings
In terms of median earnings, the demographic groups most similar to Immigrants from Uruguay are Tongan ($45,665, a difference of 0.040%), Welsh ($45,710, a difference of 0.060%), Immigrants from Ghana ($45,641, a difference of 0.090%), Immigrants from Trinidad and Tobago ($45,729, a difference of 0.10%), and Celtic ($45,732, a difference of 0.11%).
| Demographics | Rating | Rank | Median Earnings |
| Barbadians | 30.5 /100 | #197 | Fair $45,846 |
| Trinidadians and Tobagonians | 29.7 /100 | #198 | Fair $45,820 |
| Immigrants | Barbados | 29.6 /100 | #199 | Fair $45,816 |
| Immigrants | Azores | 29.5 /100 | #200 | Fair $45,812 |
| Celtics | 27.2 /100 | #201 | Fair $45,732 |
| Immigrants | Trinidad and Tobago | 27.1 /100 | #202 | Fair $45,729 |
| Welsh | 26.6 /100 | #203 | Fair $45,710 |
| Immigrants | Uruguay | 25.9 /100 | #204 | Fair $45,682 |
| Tongans | 25.4 /100 | #205 | Fair $45,665 |
| Immigrants | Ghana | 24.8 /100 | #206 | Fair $45,641 |
| Immigrants | Senegal | 24.0 /100 | #207 | Fair $45,611 |
| Immigrants | Bosnia and Herzegovina | 23.7 /100 | #208 | Fair $45,600 |
| Immigrants | Thailand | 23.7 /100 | #209 | Fair $45,598 |
| Immigrants | Grenada | 23.6 /100 | #210 | Fair $45,596 |
| Panamanians | 23.5 /100 | #211 | Fair $45,593 |
Demographics Similar to Ute by Median Earnings
In terms of median earnings, the demographic groups most similar to Ute are Immigrants from Latin America ($41,049, a difference of 0.010%), Immigrants from Caribbean ($41,119, a difference of 0.17%), Immigrants from Micronesia ($41,133, a difference of 0.20%), Shoshone ($40,932, a difference of 0.29%), and Haitian ($40,918, a difference of 0.32%).
| Demographics | Rating | Rank | Median Earnings |
| Immigrants | Zaire | 0.1 /100 | #293 | Tragic $41,325 |
| Potawatomi | 0.1 /100 | #294 | Tragic $41,288 |
| Bangladeshis | 0.1 /100 | #295 | Tragic $41,263 |
| Cherokee | 0.1 /100 | #296 | Tragic $41,252 |
| Guatemalans | 0.1 /100 | #297 | Tragic $41,205 |
| Immigrants | Micronesia | 0.1 /100 | #298 | Tragic $41,133 |
| Immigrants | Caribbean | 0.1 /100 | #299 | Tragic $41,119 |
| Ute | 0.1 /100 | #300 | Tragic $41,051 |
| Immigrants | Latin America | 0.1 /100 | #301 | Tragic $41,049 |
| Shoshone | 0.0 /100 | #302 | Tragic $40,932 |
| Haitians | 0.0 /100 | #303 | Tragic $40,918 |
| Immigrants | Guatemala | 0.0 /100 | #304 | Tragic $40,851 |
| Chickasaw | 0.0 /100 | #305 | Tragic $40,672 |
| Yaqui | 0.0 /100 | #306 | Tragic $40,647 |
| Hondurans | 0.0 /100 | #307 | Tragic $40,638 |