Immigrants from Uruguay vs Immigrants from Czechoslovakia Median Earnings
COMPARE
Immigrants from Uruguay
Immigrants from Czechoslovakia
Median Earnings
Median Earnings Comparison
Immigrants from Uruguay
Immigrants from Czechoslovakia
$45,682
MEDIAN EARNINGS
25.9/ 100
METRIC RATING
204th/ 347
METRIC RANK
$52,361
MEDIAN EARNINGS
100.0/ 100
METRIC RATING
45th/ 347
METRIC RANK
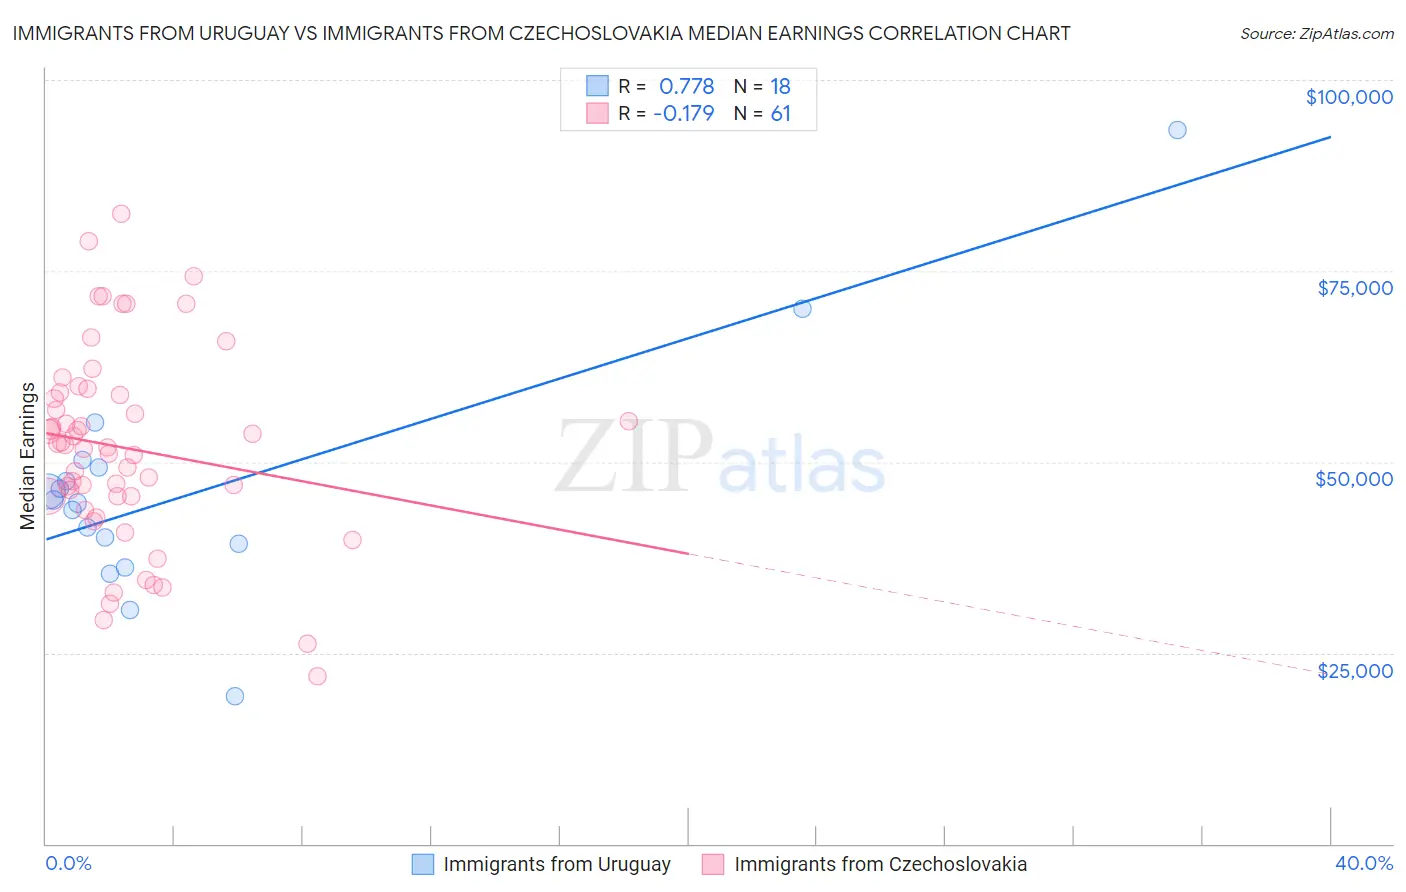
Immigrants from Uruguay vs Immigrants from Czechoslovakia Median Earnings Correlation Chart
The statistical analysis conducted on geographies consisting of 133,259,667 people shows a strong positive correlation between the proportion of Immigrants from Uruguay and median earnings in the United States with a correlation coefficient (R) of 0.778 and weighted average of $45,682. Similarly, the statistical analysis conducted on geographies consisting of 195,449,585 people shows a poor negative correlation between the proportion of Immigrants from Czechoslovakia and median earnings in the United States with a correlation coefficient (R) of -0.179 and weighted average of $52,361, a difference of 14.6%.
Median Earnings Correlation Summary
| Measurement | Immigrants from Uruguay | Immigrants from Czechoslovakia |
| Minimum | $19,375 | $21,875 |
| Maximum | $93,387 | $82,450 |
| Range | $74,012 | $60,575 |
| Mean | $46,310 | $51,817 |
| Median | $44,791 | $52,166 |
| Interquartile 25% (IQ1) | $39,250 | $45,495 |
| Interquartile 75% (IQ3) | $49,312 | $58,910 |
| Interquartile Range (IQR) | $10,062 | $13,415 |
| Standard Deviation (Sample) | $15,725 | $12,779 |
| Standard Deviation (Population) | $15,282 | $12,674 |
Similar Demographics by Median Earnings
Demographics Similar to Immigrants from Uruguay by Median Earnings
In terms of median earnings, the demographic groups most similar to Immigrants from Uruguay are Tongan ($45,665, a difference of 0.040%), Welsh ($45,710, a difference of 0.060%), Immigrants from Ghana ($45,641, a difference of 0.090%), Immigrants from Trinidad and Tobago ($45,729, a difference of 0.10%), and Celtic ($45,732, a difference of 0.11%).
| Demographics | Rating | Rank | Median Earnings |
| Barbadians | 30.5 /100 | #197 | Fair $45,846 |
| Trinidadians and Tobagonians | 29.7 /100 | #198 | Fair $45,820 |
| Immigrants | Barbados | 29.6 /100 | #199 | Fair $45,816 |
| Immigrants | Azores | 29.5 /100 | #200 | Fair $45,812 |
| Celtics | 27.2 /100 | #201 | Fair $45,732 |
| Immigrants | Trinidad and Tobago | 27.1 /100 | #202 | Fair $45,729 |
| Welsh | 26.6 /100 | #203 | Fair $45,710 |
| Immigrants | Uruguay | 25.9 /100 | #204 | Fair $45,682 |
| Tongans | 25.4 /100 | #205 | Fair $45,665 |
| Immigrants | Ghana | 24.8 /100 | #206 | Fair $45,641 |
| Immigrants | Senegal | 24.0 /100 | #207 | Fair $45,611 |
| Immigrants | Bosnia and Herzegovina | 23.7 /100 | #208 | Fair $45,600 |
| Immigrants | Thailand | 23.7 /100 | #209 | Fair $45,598 |
| Immigrants | Grenada | 23.6 /100 | #210 | Fair $45,596 |
| Panamanians | 23.5 /100 | #211 | Fair $45,593 |
Demographics Similar to Immigrants from Czechoslovakia by Median Earnings
In terms of median earnings, the demographic groups most similar to Immigrants from Czechoslovakia are Bhutanese ($52,297, a difference of 0.12%), Australian ($52,294, a difference of 0.13%), Immigrants from Malaysia ($52,514, a difference of 0.29%), Bulgarian ($52,512, a difference of 0.29%), and Maltese ($52,526, a difference of 0.31%).
| Demographics | Rating | Rank | Median Earnings |
| Latvians | 100.0 /100 | #38 | Exceptional $53,001 |
| Immigrants | Turkey | 100.0 /100 | #39 | Exceptional $52,960 |
| Israelis | 100.0 /100 | #40 | Exceptional $52,937 |
| Immigrants | Lithuania | 100.0 /100 | #41 | Exceptional $52,769 |
| Maltese | 100.0 /100 | #42 | Exceptional $52,526 |
| Immigrants | Malaysia | 100.0 /100 | #43 | Exceptional $52,514 |
| Bulgarians | 100.0 /100 | #44 | Exceptional $52,512 |
| Immigrants | Czechoslovakia | 100.0 /100 | #45 | Exceptional $52,361 |
| Bhutanese | 100.0 /100 | #46 | Exceptional $52,297 |
| Australians | 100.0 /100 | #47 | Exceptional $52,294 |
| Immigrants | Europe | 100.0 /100 | #48 | Exceptional $52,195 |
| Bolivians | 100.0 /100 | #49 | Exceptional $52,005 |
| Immigrants | South Africa | 100.0 /100 | #50 | Exceptional $51,850 |
| Immigrants | Austria | 99.9 /100 | #51 | Exceptional $51,826 |
| Estonians | 99.9 /100 | #52 | Exceptional $51,772 |