Immigrants from Belgium vs Inupiat Median Earnings
COMPARE
Immigrants from Belgium
Inupiat
Median Earnings
Median Earnings Comparison
Immigrants from Belgium
Inupiat
$54,679
MEDIAN EARNINGS
100.0/ 100
METRIC RATING
19th/ 347
METRIC RANK
$43,000
MEDIAN EARNINGS
0.8/ 100
METRIC RATING
263rd/ 347
METRIC RANK
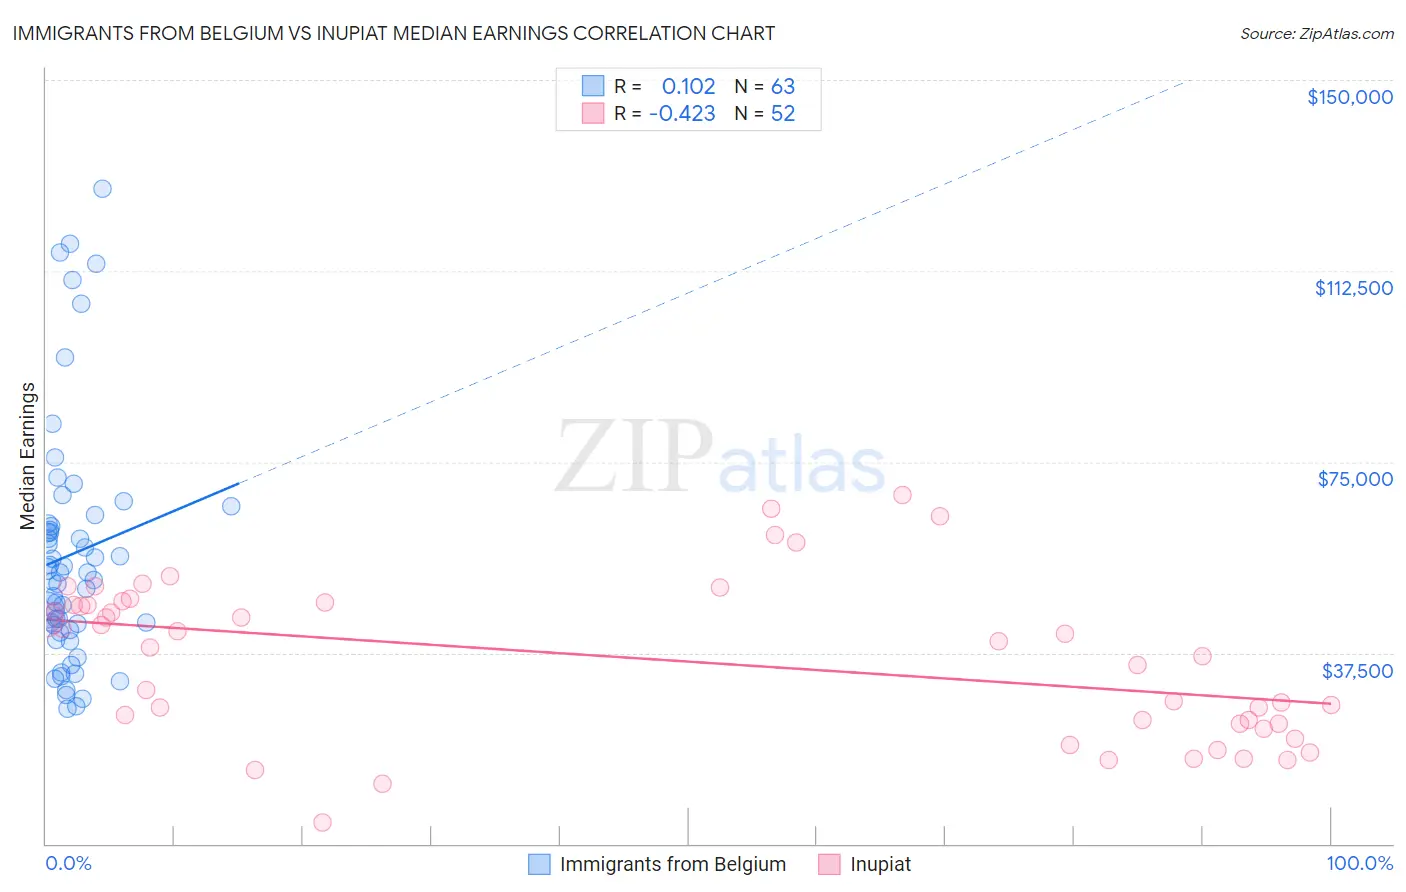
Immigrants from Belgium vs Inupiat Median Earnings Correlation Chart
The statistical analysis conducted on geographies consisting of 146,713,420 people shows a poor positive correlation between the proportion of Immigrants from Belgium and median earnings in the United States with a correlation coefficient (R) of 0.102 and weighted average of $54,679. Similarly, the statistical analysis conducted on geographies consisting of 96,339,660 people shows a moderate negative correlation between the proportion of Inupiat and median earnings in the United States with a correlation coefficient (R) of -0.423 and weighted average of $43,000, a difference of 27.2%.
Median Earnings Correlation Summary
| Measurement | Immigrants from Belgium | Inupiat |
| Minimum | $26,625 | $4,192 |
| Maximum | $128,750 | $68,590 |
| Range | $102,125 | $64,398 |
| Mean | $56,854 | $36,209 |
| Median | $53,265 | $39,208 |
| Interquartile 25% (IQ1) | $41,924 | $23,611 |
| Interquartile 75% (IQ3) | $62,836 | $47,170 |
| Interquartile Range (IQR) | $20,912 | $23,559 |
| Standard Deviation (Sample) | $23,786 | $15,551 |
| Standard Deviation (Population) | $23,597 | $15,401 |
Similar Demographics by Median Earnings
Demographics Similar to Immigrants from Belgium by Median Earnings
In terms of median earnings, the demographic groups most similar to Immigrants from Belgium are Cypriot ($54,589, a difference of 0.16%), Burmese ($54,559, a difference of 0.22%), Immigrants from Korea ($54,530, a difference of 0.27%), Immigrants from Sweden ($54,478, a difference of 0.37%), and Immigrants from Japan ($54,938, a difference of 0.47%).
| Demographics | Rating | Rank | Median Earnings |
| Immigrants | Ireland | 100.0 /100 | #12 | Exceptional $56,854 |
| Immigrants | China | 100.0 /100 | #13 | Exceptional $56,638 |
| Immigrants | Australia | 100.0 /100 | #14 | Exceptional $56,305 |
| Indians (Asian) | 100.0 /100 | #15 | Exceptional $56,253 |
| Immigrants | Eastern Asia | 100.0 /100 | #16 | Exceptional $56,183 |
| Eastern Europeans | 100.0 /100 | #17 | Exceptional $55,084 |
| Immigrants | Japan | 100.0 /100 | #18 | Exceptional $54,938 |
| Immigrants | Belgium | 100.0 /100 | #19 | Exceptional $54,679 |
| Cypriots | 100.0 /100 | #20 | Exceptional $54,589 |
| Burmese | 100.0 /100 | #21 | Exceptional $54,559 |
| Immigrants | Korea | 100.0 /100 | #22 | Exceptional $54,530 |
| Immigrants | Sweden | 100.0 /100 | #23 | Exceptional $54,478 |
| Soviet Union | 100.0 /100 | #24 | Exceptional $54,290 |
| Turks | 100.0 /100 | #25 | Exceptional $53,919 |
| Immigrants | Northern Europe | 100.0 /100 | #26 | Exceptional $53,872 |
Demographics Similar to Inupiat by Median Earnings
In terms of median earnings, the demographic groups most similar to Inupiat are Immigrants from Jamaica ($43,026, a difference of 0.060%), Nicaraguan ($43,026, a difference of 0.060%), Immigrants from Liberia ($42,923, a difference of 0.18%), Salvadoran ($42,912, a difference of 0.20%), and Immigrants from Somalia ($43,100, a difference of 0.23%).
| Demographics | Rating | Rank | Median Earnings |
| Alaskan Athabascans | 1.4 /100 | #256 | Tragic $43,393 |
| Jamaicans | 1.3 /100 | #257 | Tragic $43,343 |
| French American Indians | 1.3 /100 | #258 | Tragic $43,333 |
| German Russians | 1.1 /100 | #259 | Tragic $43,200 |
| Immigrants | Somalia | 0.9 /100 | #260 | Tragic $43,100 |
| Immigrants | Jamaica | 0.8 /100 | #261 | Tragic $43,026 |
| Nicaraguans | 0.8 /100 | #262 | Tragic $43,026 |
| Inupiat | 0.8 /100 | #263 | Tragic $43,000 |
| Immigrants | Liberia | 0.7 /100 | #264 | Tragic $42,923 |
| Salvadorans | 0.7 /100 | #265 | Tragic $42,912 |
| Immigrants | Laos | 0.7 /100 | #266 | Tragic $42,884 |
| Cree | 0.6 /100 | #267 | Tragic $42,777 |
| Americans | 0.6 /100 | #268 | Tragic $42,742 |
| Belizeans | 0.5 /100 | #269 | Tragic $42,702 |
| Osage | 0.5 /100 | #270 | Tragic $42,651 |