Immigrants from Uruguay vs French Median Earnings
COMPARE
Immigrants from Uruguay
French
Median Earnings
Median Earnings Comparison
Immigrants from Uruguay
French
$45,682
MEDIAN EARNINGS
25.9/ 100
METRIC RATING
204th/ 347
METRIC RANK
$46,296
MEDIAN EARNINGS
45.2/ 100
METRIC RATING
183rd/ 347
METRIC RANK
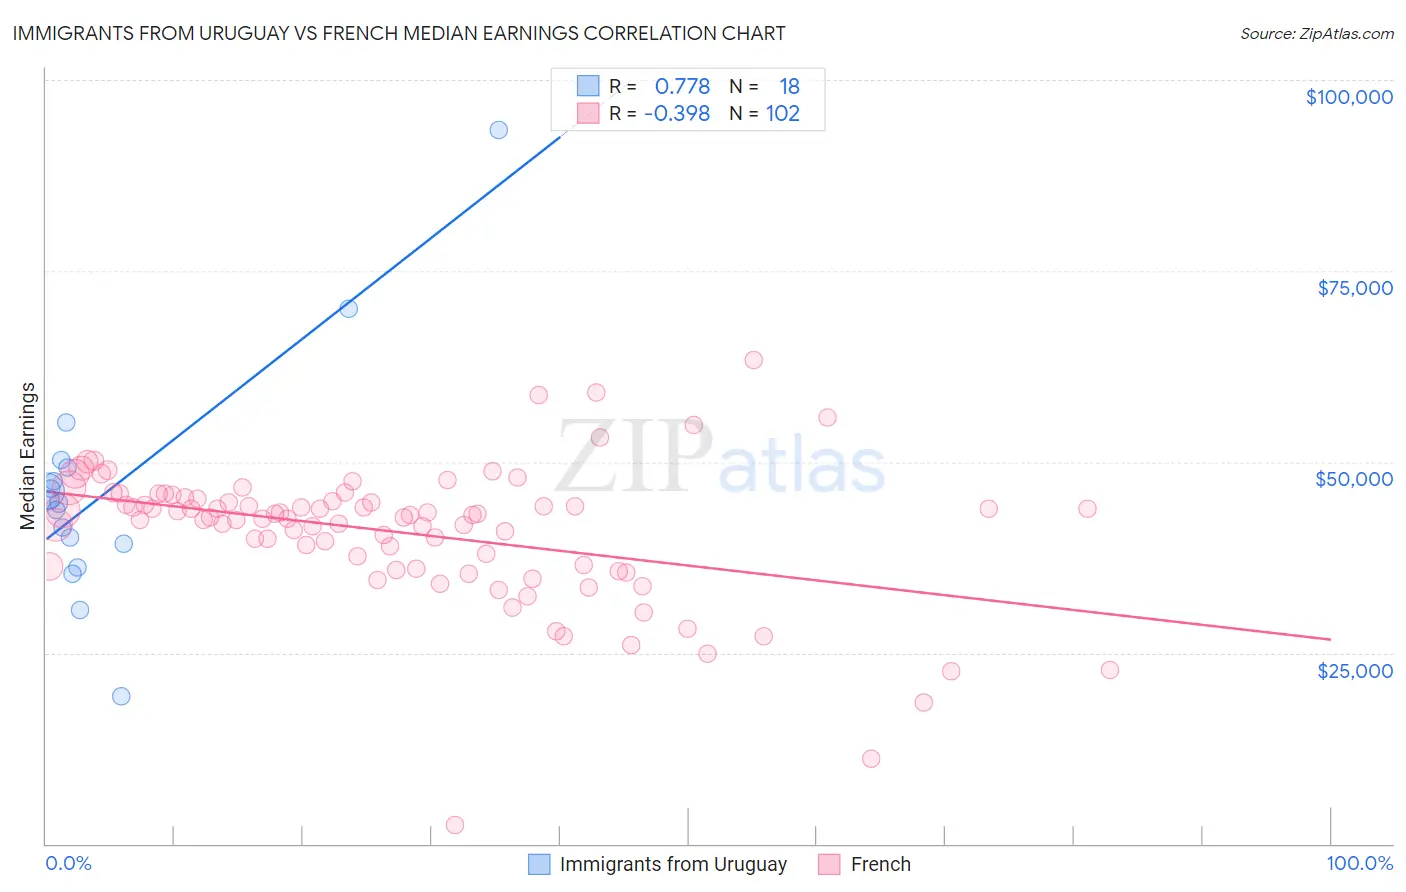
Immigrants from Uruguay vs French Median Earnings Correlation Chart
The statistical analysis conducted on geographies consisting of 133,259,667 people shows a strong positive correlation between the proportion of Immigrants from Uruguay and median earnings in the United States with a correlation coefficient (R) of 0.778 and weighted average of $45,682. Similarly, the statistical analysis conducted on geographies consisting of 572,035,046 people shows a mild negative correlation between the proportion of French and median earnings in the United States with a correlation coefficient (R) of -0.398 and weighted average of $46,296, a difference of 1.3%.
Median Earnings Correlation Summary
| Measurement | Immigrants from Uruguay | French |
| Minimum | $19,375 | $2,499 |
| Maximum | $93,387 | $63,271 |
| Range | $74,012 | $60,772 |
| Mean | $46,310 | $40,779 |
| Median | $44,791 | $42,886 |
| Interquartile 25% (IQ1) | $39,250 | $36,330 |
| Interquartile 75% (IQ3) | $49,312 | $45,125 |
| Interquartile Range (IQR) | $10,062 | $8,794 |
| Standard Deviation (Sample) | $15,725 | $9,085 |
| Standard Deviation (Population) | $15,282 | $9,040 |
Similar Demographics by Median Earnings
Demographics Similar to Immigrants from Uruguay by Median Earnings
In terms of median earnings, the demographic groups most similar to Immigrants from Uruguay are Tongan ($45,665, a difference of 0.040%), Welsh ($45,710, a difference of 0.060%), Immigrants from Ghana ($45,641, a difference of 0.090%), Immigrants from Trinidad and Tobago ($45,729, a difference of 0.10%), and Celtic ($45,732, a difference of 0.11%).
| Demographics | Rating | Rank | Median Earnings |
| Barbadians | 30.5 /100 | #197 | Fair $45,846 |
| Trinidadians and Tobagonians | 29.7 /100 | #198 | Fair $45,820 |
| Immigrants | Barbados | 29.6 /100 | #199 | Fair $45,816 |
| Immigrants | Azores | 29.5 /100 | #200 | Fair $45,812 |
| Celtics | 27.2 /100 | #201 | Fair $45,732 |
| Immigrants | Trinidad and Tobago | 27.1 /100 | #202 | Fair $45,729 |
| Welsh | 26.6 /100 | #203 | Fair $45,710 |
| Immigrants | Uruguay | 25.9 /100 | #204 | Fair $45,682 |
| Tongans | 25.4 /100 | #205 | Fair $45,665 |
| Immigrants | Ghana | 24.8 /100 | #206 | Fair $45,641 |
| Immigrants | Senegal | 24.0 /100 | #207 | Fair $45,611 |
| Immigrants | Bosnia and Herzegovina | 23.7 /100 | #208 | Fair $45,600 |
| Immigrants | Thailand | 23.7 /100 | #209 | Fair $45,598 |
| Immigrants | Grenada | 23.6 /100 | #210 | Fair $45,596 |
| Panamanians | 23.5 /100 | #211 | Fair $45,593 |
Demographics Similar to French by Median Earnings
In terms of median earnings, the demographic groups most similar to French are Swiss ($46,315, a difference of 0.040%), Immigrants from Cameroon ($46,329, a difference of 0.070%), English ($46,334, a difference of 0.080%), Puget Sound Salish ($46,333, a difference of 0.080%), and Colombian ($46,349, a difference of 0.12%).
| Demographics | Rating | Rank | Median Earnings |
| Danes | 48.6 /100 | #176 | Average $46,392 |
| Belgians | 48.0 /100 | #177 | Average $46,375 |
| Colombians | 47.1 /100 | #178 | Average $46,349 |
| English | 46.5 /100 | #179 | Average $46,334 |
| Puget Sound Salish | 46.5 /100 | #180 | Average $46,333 |
| Immigrants | Cameroon | 46.4 /100 | #181 | Average $46,329 |
| Swiss | 45.9 /100 | #182 | Average $46,315 |
| French | 45.2 /100 | #183 | Average $46,296 |
| Immigrants | Kenya | 42.4 /100 | #184 | Average $46,214 |
| Uruguayans | 41.6 /100 | #185 | Average $46,190 |
| Vietnamese | 40.9 /100 | #186 | Average $46,172 |
| Iraqis | 39.9 /100 | #187 | Fair $46,140 |
| Immigrants | Armenia | 38.3 /100 | #188 | Fair $46,094 |
| Spaniards | 37.2 /100 | #189 | Fair $46,059 |
| French Canadians | 36.1 /100 | #190 | Fair $46,026 |