Macedonian vs Inupiat Median Earnings
COMPARE
Macedonian
Inupiat
Median Earnings
Median Earnings Comparison
Macedonians
Inupiat
$49,893
MEDIAN EARNINGS
99.2/ 100
METRIC RATING
91st/ 347
METRIC RANK
$43,000
MEDIAN EARNINGS
0.8/ 100
METRIC RATING
263rd/ 347
METRIC RANK
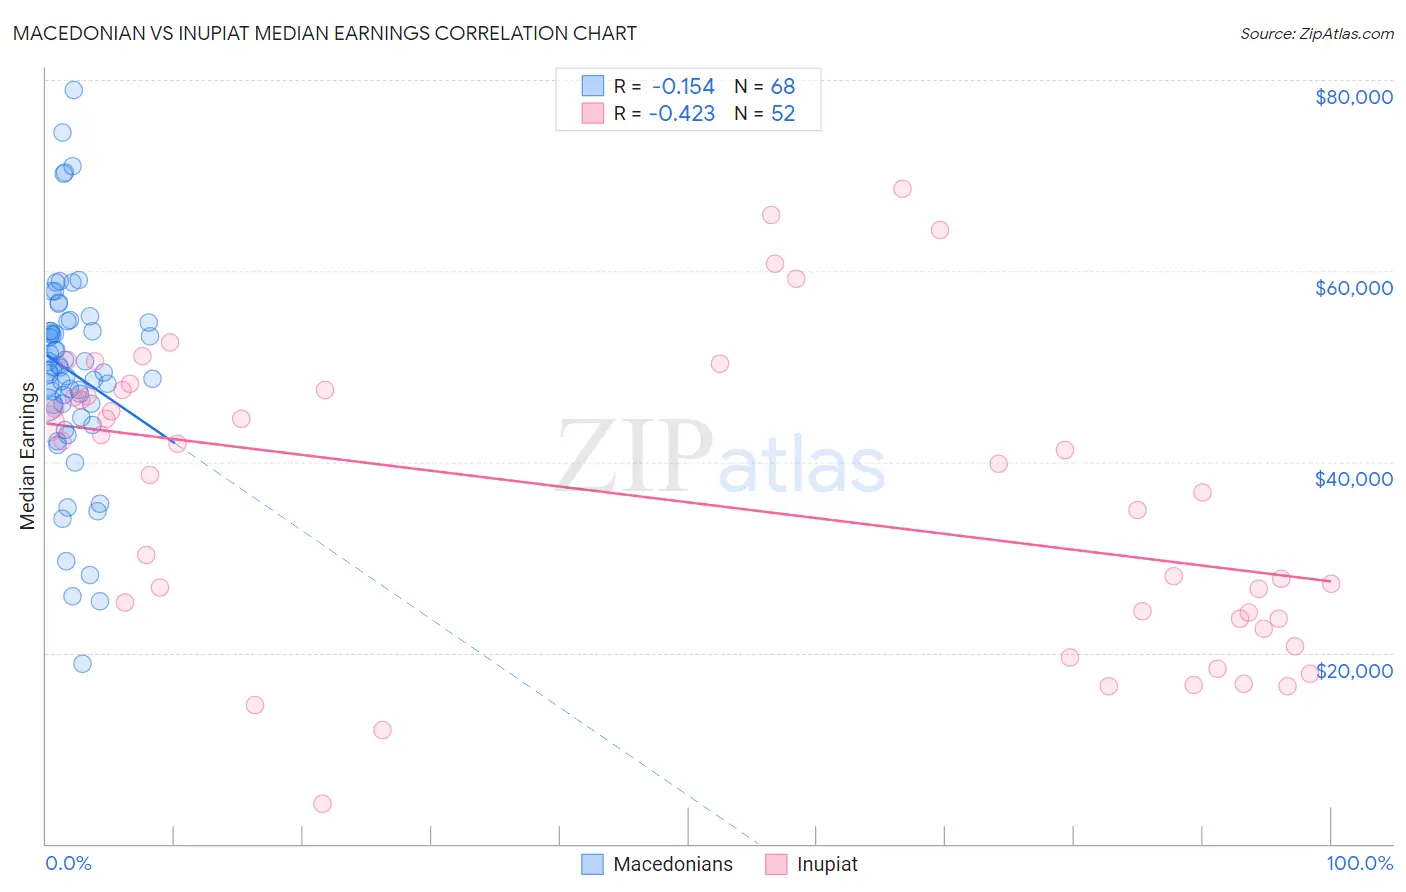
Macedonian vs Inupiat Median Earnings Correlation Chart
The statistical analysis conducted on geographies consisting of 132,586,624 people shows a poor negative correlation between the proportion of Macedonians and median earnings in the United States with a correlation coefficient (R) of -0.154 and weighted average of $49,893. Similarly, the statistical analysis conducted on geographies consisting of 96,339,660 people shows a moderate negative correlation between the proportion of Inupiat and median earnings in the United States with a correlation coefficient (R) of -0.423 and weighted average of $43,000, a difference of 16.0%.
Median Earnings Correlation Summary
| Measurement | Macedonian | Inupiat |
| Minimum | $18,816 | $4,192 |
| Maximum | $78,907 | $68,590 |
| Range | $60,091 | $64,398 |
| Mean | $49,392 | $36,209 |
| Median | $49,655 | $39,208 |
| Interquartile 25% (IQ1) | $45,965 | $23,611 |
| Interquartile 75% (IQ3) | $54,145 | $47,170 |
| Interquartile Range (IQR) | $8,180 | $23,559 |
| Standard Deviation (Sample) | $10,833 | $15,551 |
| Standard Deviation (Population) | $10,753 | $15,401 |
Similar Demographics by Median Earnings
Demographics Similar to Macedonians by Median Earnings
In terms of median earnings, the demographic groups most similar to Macedonians are Italian ($49,915, a difference of 0.040%), Immigrants from Argentina ($49,841, a difference of 0.11%), Armenian ($49,804, a difference of 0.18%), Croatian ($49,724, a difference of 0.34%), and Immigrants from England ($49,722, a difference of 0.34%).
| Demographics | Rating | Rank | Median Earnings |
| Immigrants | Hungary | 99.5 /100 | #84 | Exceptional $50,227 |
| Immigrants | Kazakhstan | 99.5 /100 | #85 | Exceptional $50,225 |
| Immigrants | Canada | 99.5 /100 | #86 | Exceptional $50,192 |
| Immigrants | Uzbekistan | 99.5 /100 | #87 | Exceptional $50,151 |
| Albanians | 99.4 /100 | #88 | Exceptional $50,116 |
| Immigrants | North America | 99.4 /100 | #89 | Exceptional $50,108 |
| Italians | 99.3 /100 | #90 | Exceptional $49,915 |
| Macedonians | 99.2 /100 | #91 | Exceptional $49,893 |
| Immigrants | Argentina | 99.2 /100 | #92 | Exceptional $49,841 |
| Armenians | 99.1 /100 | #93 | Exceptional $49,804 |
| Croatians | 99.0 /100 | #94 | Exceptional $49,724 |
| Immigrants | England | 99.0 /100 | #95 | Exceptional $49,722 |
| Immigrants | Lebanon | 99.0 /100 | #96 | Exceptional $49,682 |
| Immigrants | North Macedonia | 98.9 /100 | #97 | Exceptional $49,658 |
| Immigrants | Northern Africa | 98.9 /100 | #98 | Exceptional $49,648 |
Demographics Similar to Inupiat by Median Earnings
In terms of median earnings, the demographic groups most similar to Inupiat are Immigrants from Jamaica ($43,026, a difference of 0.060%), Nicaraguan ($43,026, a difference of 0.060%), Immigrants from Liberia ($42,923, a difference of 0.18%), Salvadoran ($42,912, a difference of 0.20%), and Immigrants from Somalia ($43,100, a difference of 0.23%).
| Demographics | Rating | Rank | Median Earnings |
| Alaskan Athabascans | 1.4 /100 | #256 | Tragic $43,393 |
| Jamaicans | 1.3 /100 | #257 | Tragic $43,343 |
| French American Indians | 1.3 /100 | #258 | Tragic $43,333 |
| German Russians | 1.1 /100 | #259 | Tragic $43,200 |
| Immigrants | Somalia | 0.9 /100 | #260 | Tragic $43,100 |
| Immigrants | Jamaica | 0.8 /100 | #261 | Tragic $43,026 |
| Nicaraguans | 0.8 /100 | #262 | Tragic $43,026 |
| Inupiat | 0.8 /100 | #263 | Tragic $43,000 |
| Immigrants | Liberia | 0.7 /100 | #264 | Tragic $42,923 |
| Salvadorans | 0.7 /100 | #265 | Tragic $42,912 |
| Immigrants | Laos | 0.7 /100 | #266 | Tragic $42,884 |
| Cree | 0.6 /100 | #267 | Tragic $42,777 |
| Americans | 0.6 /100 | #268 | Tragic $42,742 |
| Belizeans | 0.5 /100 | #269 | Tragic $42,702 |
| Osage | 0.5 /100 | #270 | Tragic $42,651 |