Immigrants from Uruguay vs Inupiat Unemployment
COMPARE
Immigrants from Uruguay
Inupiat
Unemployment
Unemployment Comparison
Immigrants from Uruguay
Inupiat
5.3%
UNEMPLOYMENT
29.8/ 100
METRIC RATING
197th/ 347
METRIC RANK
10.1%
UNEMPLOYMENT
0.0/ 100
METRIC RATING
345th/ 347
METRIC RANK
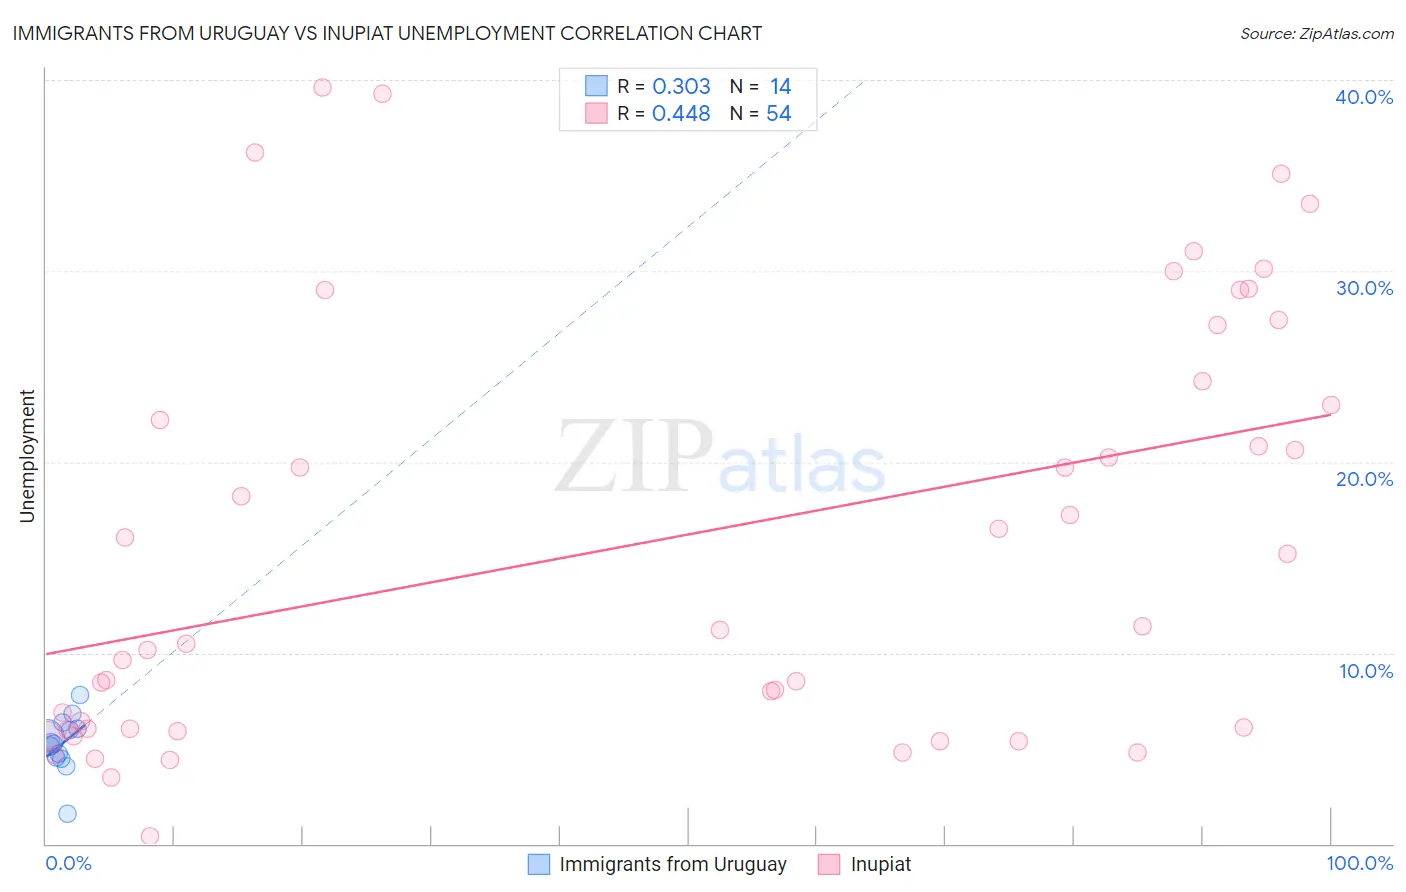
Immigrants from Uruguay vs Inupiat Unemployment Correlation Chart
The statistical analysis conducted on geographies consisting of 133,243,021 people shows a mild positive correlation between the proportion of Immigrants from Uruguay and unemployment in the United States with a correlation coefficient (R) of 0.303 and weighted average of 5.3%. Similarly, the statistical analysis conducted on geographies consisting of 96,296,891 people shows a moderate positive correlation between the proportion of Inupiat and unemployment in the United States with a correlation coefficient (R) of 0.448 and weighted average of 10.1%, a difference of 89.8%.
Unemployment Correlation Summary
| Measurement | Immigrants from Uruguay | Inupiat |
| Minimum | 1.6% | 0.40% |
| Maximum | 7.8% | 39.6% |
| Range | 6.2% | 39.2% |
| Mean | 5.2% | 15.9% |
| Median | 5.3% | 11.3% |
| Interquartile 25% (IQ1) | 4.5% | 6.0% |
| Interquartile 75% (IQ3) | 6.0% | 24.2% |
| Interquartile Range (IQR) | 1.5% | 18.2% |
| Standard Deviation (Sample) | 1.5% | 11.0% |
| Standard Deviation (Population) | 1.4% | 10.9% |
Similar Demographics by Unemployment
Demographics Similar to Immigrants from Uruguay by Unemployment
In terms of unemployment, the demographic groups most similar to Immigrants from Uruguay are Peruvian (5.3%, a difference of 0.010%), Immigrants from Laos (5.3%, a difference of 0.080%), Immigrants from Southern Europe (5.3%, a difference of 0.080%), Immigrants from Israel (5.3%, a difference of 0.090%), and Immigrants from Afghanistan (5.3%, a difference of 0.090%).
| Demographics | Rating | Rank | Unemployment |
| Arabs | 35.3 /100 | #190 | Fair 5.3% |
| Somalis | 34.0 /100 | #191 | Fair 5.3% |
| South Americans | 33.9 /100 | #192 | Fair 5.3% |
| Immigrants | Somalia | 33.8 /100 | #193 | Fair 5.3% |
| Immigrants | Laos | 30.9 /100 | #194 | Fair 5.3% |
| Immigrants | Southern Europe | 30.9 /100 | #195 | Fair 5.3% |
| Peruvians | 29.9 /100 | #196 | Fair 5.3% |
| Immigrants | Uruguay | 29.8 /100 | #197 | Fair 5.3% |
| Immigrants | Israel | 28.6 /100 | #198 | Fair 5.3% |
| Immigrants | Afghanistan | 28.6 /100 | #199 | Fair 5.3% |
| Koreans | 27.4 /100 | #200 | Fair 5.3% |
| Immigrants | South Eastern Asia | 27.0 /100 | #201 | Fair 5.3% |
| Cherokee | 25.5 /100 | #202 | Fair 5.3% |
| Immigrants | Micronesia | 25.2 /100 | #203 | Fair 5.3% |
| Immigrants | Ukraine | 24.9 /100 | #204 | Fair 5.3% |
Demographics Similar to Inupiat by Unemployment
In terms of unemployment, the demographic groups most similar to Inupiat are Arapaho (9.8%, a difference of 2.9%), Crow (11.1%, a difference of 9.4%), Yuman (9.1%, a difference of 11.6%), Hopi (8.9%, a difference of 13.5%), and Tohono O'odham (8.9%, a difference of 14.0%).
| Demographics | Rating | Rank | Unemployment |
| Immigrants | Dominican Republic | 0.0 /100 | #333 | Tragic 7.4% |
| Apache | 0.0 /100 | #334 | Tragic 7.4% |
| Alaskan Athabascans | 0.0 /100 | #335 | Tragic 7.7% |
| Immigrants | Yemen | 0.0 /100 | #336 | Tragic 7.7% |
| Cheyenne | 0.0 /100 | #337 | Tragic 8.0% |
| Pima | 0.0 /100 | #338 | Tragic 8.2% |
| Navajo | 0.0 /100 | #339 | Tragic 8.4% |
| Puerto Ricans | 0.0 /100 | #340 | Tragic 8.4% |
| Tohono O'odham | 0.0 /100 | #341 | Tragic 8.9% |
| Hopi | 0.0 /100 | #342 | Tragic 8.9% |
| Yuman | 0.0 /100 | #343 | Tragic 9.1% |
| Arapaho | 0.0 /100 | #344 | Tragic 9.8% |
| Inupiat | 0.0 /100 | #345 | Tragic 10.1% |
| Crow | 0.0 /100 | #346 | Tragic 11.1% |
| Yup'ik | 0.0 /100 | #347 | Tragic 13.6% |