Immigrants from Ukraine vs Immigrants from Laos Median Male Earnings
COMPARE
Immigrants from Ukraine
Immigrants from Laos
Median Male Earnings
Median Male Earnings Comparison
Immigrants from Ukraine
Immigrants from Laos
$59,820
MEDIAN MALE EARNINGS
99.5/ 100
METRIC RATING
79th/ 347
METRIC RANK
$49,190
MEDIAN MALE EARNINGS
0.6/ 100
METRIC RATING
265th/ 347
METRIC RANK
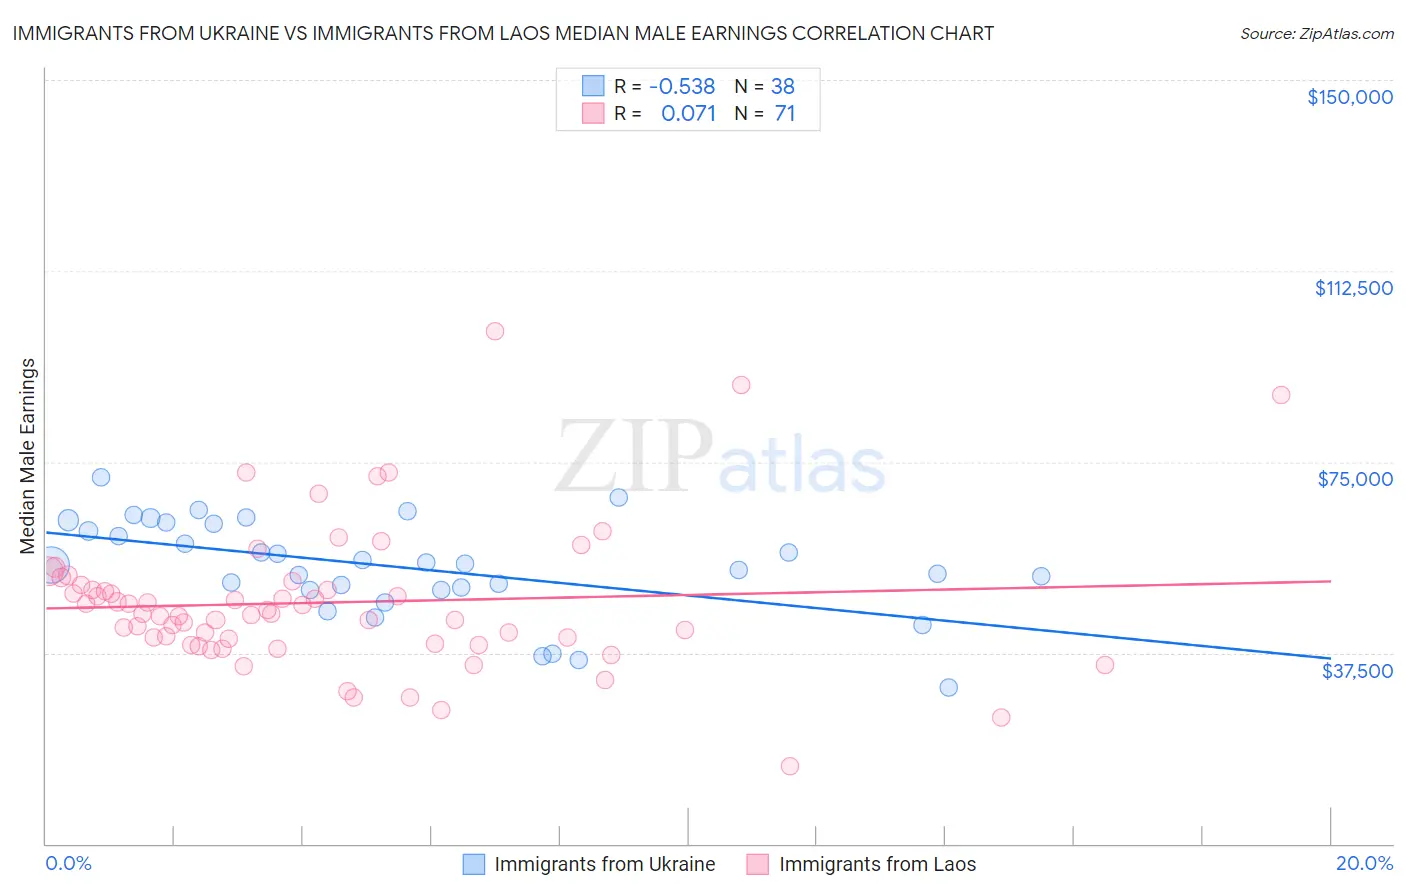
Immigrants from Ukraine vs Immigrants from Laos Median Male Earnings Correlation Chart
The statistical analysis conducted on geographies consisting of 289,634,728 people shows a substantial negative correlation between the proportion of Immigrants from Ukraine and median male earnings in the United States with a correlation coefficient (R) of -0.538 and weighted average of $59,820. Similarly, the statistical analysis conducted on geographies consisting of 201,459,806 people shows a slight positive correlation between the proportion of Immigrants from Laos and median male earnings in the United States with a correlation coefficient (R) of 0.071 and weighted average of $49,190, a difference of 21.6%.
Median Male Earnings Correlation Summary
| Measurement | Immigrants from Ukraine | Immigrants from Laos |
| Minimum | $30,721 | $15,268 |
| Maximum | $71,961 | $100,625 |
| Range | $41,240 | $85,357 |
| Mean | $54,290 | $47,381 |
| Median | $54,853 | $45,153 |
| Interquartile 25% (IQ1) | $49,956 | $39,274 |
| Interquartile 75% (IQ3) | $62,824 | $50,916 |
| Interquartile Range (IQR) | $12,868 | $11,642 |
| Standard Deviation (Sample) | $9,509 | $14,342 |
| Standard Deviation (Population) | $9,383 | $14,241 |
Similar Demographics by Median Male Earnings
Demographics Similar to Immigrants from Ukraine by Median Male Earnings
In terms of median male earnings, the demographic groups most similar to Immigrants from Ukraine are Immigrants from Hungary ($59,806, a difference of 0.020%), Ukrainian ($59,728, a difference of 0.16%), Immigrants from Egypt ($59,925, a difference of 0.18%), Croatian ($59,715, a difference of 0.18%), and Immigrants from Italy ($59,691, a difference of 0.22%).
| Demographics | Rating | Rank | Median Male Earnings |
| Immigrants | Western Europe | 99.7 /100 | #72 | Exceptional $60,334 |
| Immigrants | North America | 99.7 /100 | #73 | Exceptional $60,265 |
| Argentineans | 99.6 /100 | #74 | Exceptional $60,117 |
| Immigrants | Bolivia | 99.6 /100 | #75 | Exceptional $60,088 |
| Romanians | 99.6 /100 | #76 | Exceptional $60,063 |
| Paraguayans | 99.5 /100 | #77 | Exceptional $59,975 |
| Immigrants | Egypt | 99.5 /100 | #78 | Exceptional $59,925 |
| Immigrants | Ukraine | 99.5 /100 | #79 | Exceptional $59,820 |
| Immigrants | Hungary | 99.5 /100 | #80 | Exceptional $59,806 |
| Ukrainians | 99.4 /100 | #81 | Exceptional $59,728 |
| Croatians | 99.4 /100 | #82 | Exceptional $59,715 |
| Immigrants | Italy | 99.4 /100 | #83 | Exceptional $59,691 |
| Afghans | 99.3 /100 | #84 | Exceptional $59,554 |
| Italians | 99.3 /100 | #85 | Exceptional $59,551 |
| Immigrants | England | 99.3 /100 | #86 | Exceptional $59,527 |
Demographics Similar to Immigrants from Laos by Median Male Earnings
In terms of median male earnings, the demographic groups most similar to Immigrants from Laos are Immigrants from Middle Africa ($49,201, a difference of 0.020%), Nicaraguan ($49,215, a difference of 0.050%), Immigrants from West Indies ($49,271, a difference of 0.16%), Liberian ($49,318, a difference of 0.26%), and Somali ($49,025, a difference of 0.34%).
| Demographics | Rating | Rank | Median Male Earnings |
| Cree | 0.7 /100 | #258 | Tragic $49,497 |
| Nepalese | 0.7 /100 | #259 | Tragic $49,458 |
| Iroquois | 0.7 /100 | #260 | Tragic $49,374 |
| Liberians | 0.6 /100 | #261 | Tragic $49,318 |
| Immigrants | West Indies | 0.6 /100 | #262 | Tragic $49,271 |
| Nicaraguans | 0.6 /100 | #263 | Tragic $49,215 |
| Immigrants | Middle Africa | 0.6 /100 | #264 | Tragic $49,201 |
| Immigrants | Laos | 0.6 /100 | #265 | Tragic $49,190 |
| Somalis | 0.5 /100 | #266 | Tragic $49,025 |
| Spanish Americans | 0.5 /100 | #267 | Tragic $49,008 |
| Ute | 0.4 /100 | #268 | Tragic $48,899 |
| Tsimshian | 0.4 /100 | #269 | Tragic $48,836 |
| Potawatomi | 0.4 /100 | #270 | Tragic $48,768 |
| Cherokee | 0.3 /100 | #271 | Tragic $48,669 |
| Salvadorans | 0.3 /100 | #272 | Tragic $48,646 |