Immigrants from Ukraine vs Immigrants from Indonesia Median Male Earnings
COMPARE
Immigrants from Ukraine
Immigrants from Indonesia
Median Male Earnings
Median Male Earnings Comparison
Immigrants from Ukraine
Immigrants from Indonesia
$59,820
MEDIAN MALE EARNINGS
99.5/ 100
METRIC RATING
79th/ 347
METRIC RANK
$60,935
MEDIAN MALE EARNINGS
99.8/ 100
METRIC RATING
65th/ 347
METRIC RANK
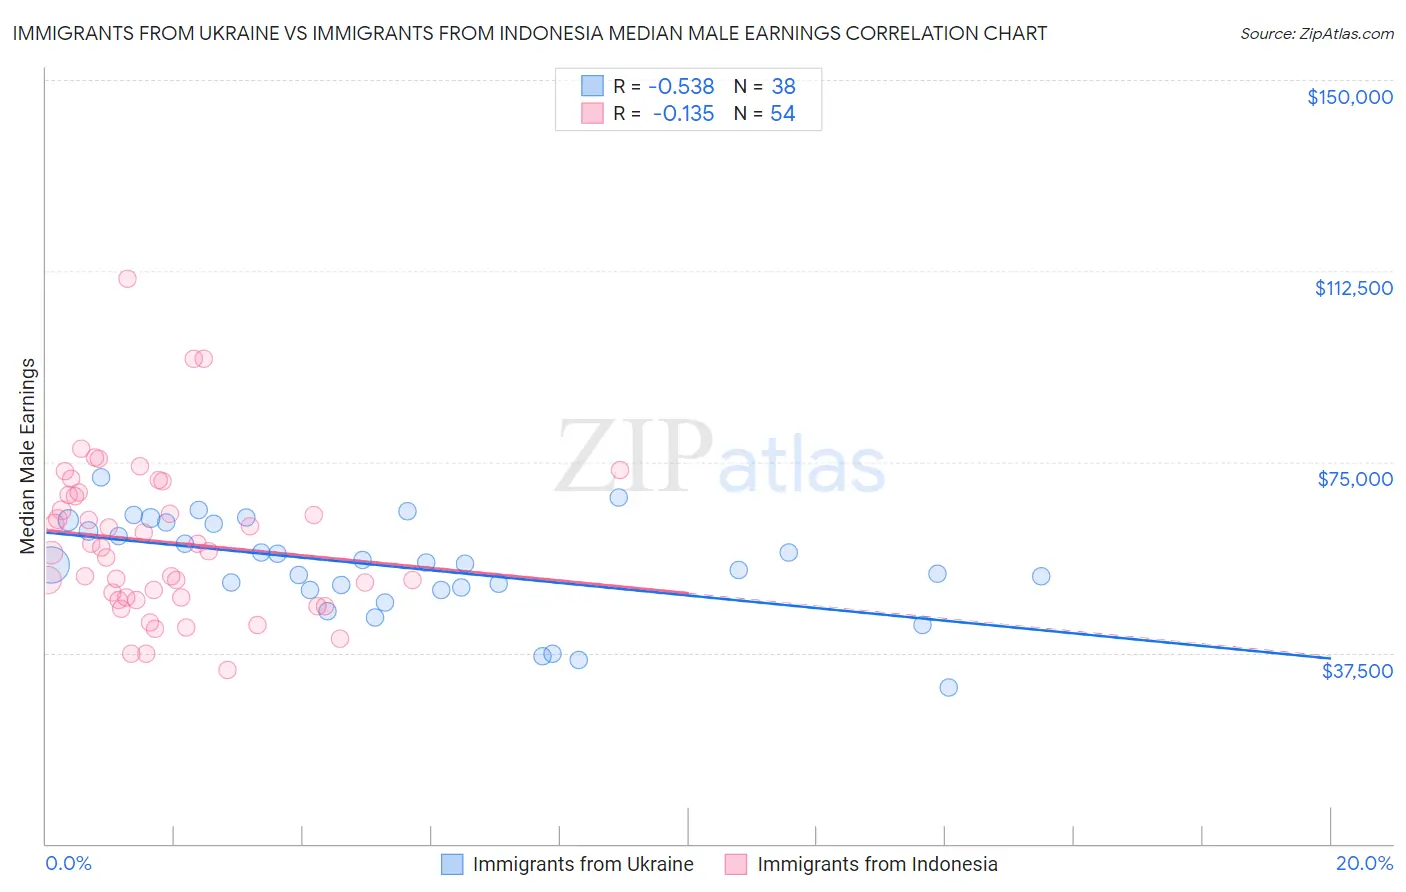
Immigrants from Ukraine vs Immigrants from Indonesia Median Male Earnings Correlation Chart
The statistical analysis conducted on geographies consisting of 289,634,728 people shows a substantial negative correlation between the proportion of Immigrants from Ukraine and median male earnings in the United States with a correlation coefficient (R) of -0.538 and weighted average of $59,820. Similarly, the statistical analysis conducted on geographies consisting of 215,756,061 people shows a poor negative correlation between the proportion of Immigrants from Indonesia and median male earnings in the United States with a correlation coefficient (R) of -0.135 and weighted average of $60,935, a difference of 1.9%.
Median Male Earnings Correlation Summary
| Measurement | Immigrants from Ukraine | Immigrants from Indonesia |
| Minimum | $30,721 | $34,072 |
| Maximum | $71,961 | $111,048 |
| Range | $41,240 | $76,976 |
| Mean | $54,290 | $59,341 |
| Median | $54,853 | $57,826 |
| Interquartile 25% (IQ1) | $49,956 | $48,312 |
| Interquartile 75% (IQ3) | $62,824 | $68,539 |
| Interquartile Range (IQR) | $12,868 | $20,227 |
| Standard Deviation (Sample) | $9,509 | $15,206 |
| Standard Deviation (Population) | $9,383 | $15,065 |
Demographics Similar to Immigrants from Ukraine and Immigrants from Indonesia by Median Male Earnings
In terms of median male earnings, the demographic groups most similar to Immigrants from Ukraine are Immigrants from Hungary ($59,806, a difference of 0.020%), Ukrainian ($59,728, a difference of 0.16%), Immigrants from Egypt ($59,925, a difference of 0.18%), Croatian ($59,715, a difference of 0.18%), and Paraguayan ($59,975, a difference of 0.26%). Similarly, the demographic groups most similar to Immigrants from Indonesia are Immigrants from Croatia ($60,914, a difference of 0.030%), Immigrants from Eastern Europe ($60,958, a difference of 0.040%), Immigrants from Pakistan ($60,987, a difference of 0.080%), Immigrants from Romania ($61,040, a difference of 0.17%), and Immigrants from Spain ($60,750, a difference of 0.30%).
| Demographics | Rating | Rank | Median Male Earnings |
| Immigrants | Romania | 99.8 /100 | #62 | Exceptional $61,040 |
| Immigrants | Pakistan | 99.8 /100 | #63 | Exceptional $60,987 |
| Immigrants | Eastern Europe | 99.8 /100 | #64 | Exceptional $60,958 |
| Immigrants | Indonesia | 99.8 /100 | #65 | Exceptional $60,935 |
| Immigrants | Croatia | 99.8 /100 | #66 | Exceptional $60,914 |
| Immigrants | Spain | 99.8 /100 | #67 | Exceptional $60,750 |
| Immigrants | Serbia | 99.7 /100 | #68 | Exceptional $60,600 |
| Immigrants | Canada | 99.7 /100 | #69 | Exceptional $60,388 |
| Immigrants | Bulgaria | 99.7 /100 | #70 | Exceptional $60,358 |
| Mongolians | 99.7 /100 | #71 | Exceptional $60,350 |
| Immigrants | Western Europe | 99.7 /100 | #72 | Exceptional $60,334 |
| Immigrants | North America | 99.7 /100 | #73 | Exceptional $60,265 |
| Argentineans | 99.6 /100 | #74 | Exceptional $60,117 |
| Immigrants | Bolivia | 99.6 /100 | #75 | Exceptional $60,088 |
| Romanians | 99.6 /100 | #76 | Exceptional $60,063 |
| Paraguayans | 99.5 /100 | #77 | Exceptional $59,975 |
| Immigrants | Egypt | 99.5 /100 | #78 | Exceptional $59,925 |
| Immigrants | Ukraine | 99.5 /100 | #79 | Exceptional $59,820 |
| Immigrants | Hungary | 99.5 /100 | #80 | Exceptional $59,806 |
| Ukrainians | 99.4 /100 | #81 | Exceptional $59,728 |
| Croatians | 99.4 /100 | #82 | Exceptional $59,715 |