Immigrants from Ukraine vs Slavic Median Male Earnings
COMPARE
Immigrants from Ukraine
Slavic
Median Male Earnings
Median Male Earnings Comparison
Immigrants from Ukraine
Slavs
$59,820
MEDIAN MALE EARNINGS
99.5/ 100
METRIC RATING
79th/ 347
METRIC RANK
$56,390
MEDIAN MALE EARNINGS
86.5/ 100
METRIC RATING
137th/ 347
METRIC RANK
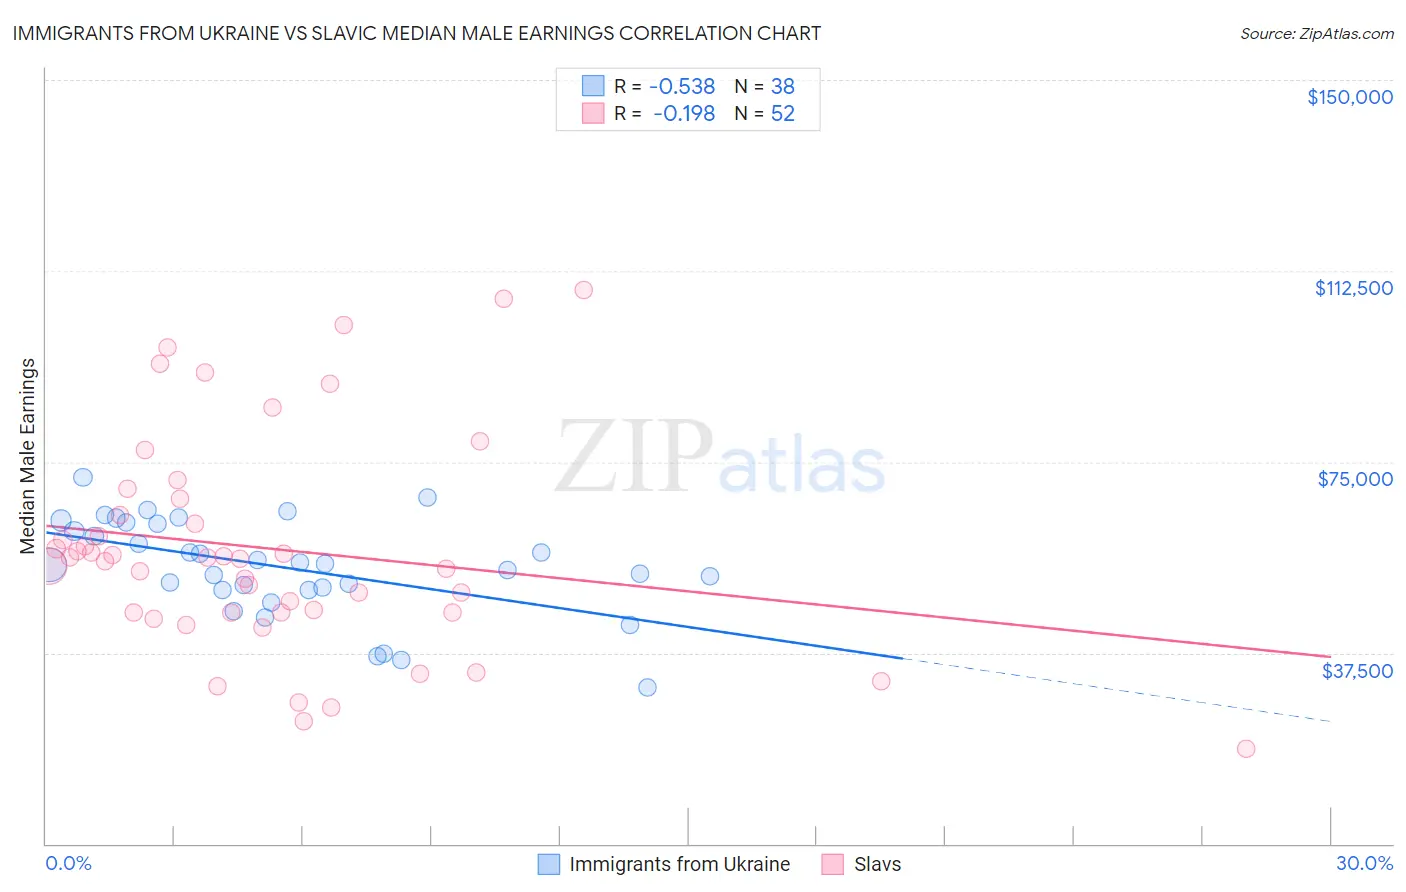
Immigrants from Ukraine vs Slavic Median Male Earnings Correlation Chart
The statistical analysis conducted on geographies consisting of 289,634,728 people shows a substantial negative correlation between the proportion of Immigrants from Ukraine and median male earnings in the United States with a correlation coefficient (R) of -0.538 and weighted average of $59,820. Similarly, the statistical analysis conducted on geographies consisting of 270,818,256 people shows a poor negative correlation between the proportion of Slavs and median male earnings in the United States with a correlation coefficient (R) of -0.198 and weighted average of $56,390, a difference of 6.1%.
Median Male Earnings Correlation Summary
| Measurement | Immigrants from Ukraine | Slavic |
| Minimum | $30,721 | $18,676 |
| Maximum | $71,961 | $108,806 |
| Range | $41,240 | $90,130 |
| Mean | $54,290 | $57,922 |
| Median | $54,853 | $56,132 |
| Interquartile 25% (IQ1) | $49,956 | $45,442 |
| Interquartile 75% (IQ3) | $62,824 | $66,210 |
| Interquartile Range (IQR) | $12,868 | $20,768 |
| Standard Deviation (Sample) | $9,509 | $21,311 |
| Standard Deviation (Population) | $9,383 | $21,105 |
Similar Demographics by Median Male Earnings
Demographics Similar to Immigrants from Ukraine by Median Male Earnings
In terms of median male earnings, the demographic groups most similar to Immigrants from Ukraine are Immigrants from Hungary ($59,806, a difference of 0.020%), Ukrainian ($59,728, a difference of 0.16%), Immigrants from Egypt ($59,925, a difference of 0.18%), Croatian ($59,715, a difference of 0.18%), and Immigrants from Italy ($59,691, a difference of 0.22%).
| Demographics | Rating | Rank | Median Male Earnings |
| Immigrants | Western Europe | 99.7 /100 | #72 | Exceptional $60,334 |
| Immigrants | North America | 99.7 /100 | #73 | Exceptional $60,265 |
| Argentineans | 99.6 /100 | #74 | Exceptional $60,117 |
| Immigrants | Bolivia | 99.6 /100 | #75 | Exceptional $60,088 |
| Romanians | 99.6 /100 | #76 | Exceptional $60,063 |
| Paraguayans | 99.5 /100 | #77 | Exceptional $59,975 |
| Immigrants | Egypt | 99.5 /100 | #78 | Exceptional $59,925 |
| Immigrants | Ukraine | 99.5 /100 | #79 | Exceptional $59,820 |
| Immigrants | Hungary | 99.5 /100 | #80 | Exceptional $59,806 |
| Ukrainians | 99.4 /100 | #81 | Exceptional $59,728 |
| Croatians | 99.4 /100 | #82 | Exceptional $59,715 |
| Immigrants | Italy | 99.4 /100 | #83 | Exceptional $59,691 |
| Afghans | 99.3 /100 | #84 | Exceptional $59,554 |
| Italians | 99.3 /100 | #85 | Exceptional $59,551 |
| Immigrants | England | 99.3 /100 | #86 | Exceptional $59,527 |
Demographics Similar to Slavs by Median Male Earnings
In terms of median male earnings, the demographic groups most similar to Slavs are Immigrants from Saudi Arabia ($56,452, a difference of 0.11%), Irish ($56,464, a difference of 0.13%), Slovak ($56,306, a difference of 0.15%), Zimbabwean ($56,302, a difference of 0.16%), and Luxembourger ($56,300, a difference of 0.16%).
| Demographics | Rating | Rank | Median Male Earnings |
| Koreans | 89.4 /100 | #130 | Excellent $56,672 |
| Portuguese | 89.4 /100 | #131 | Excellent $56,663 |
| Czechs | 88.2 /100 | #132 | Excellent $56,546 |
| Immigrants | Germany | 88.2 /100 | #133 | Excellent $56,542 |
| Moroccans | 87.7 /100 | #134 | Excellent $56,499 |
| Irish | 87.4 /100 | #135 | Excellent $56,464 |
| Immigrants | Saudi Arabia | 87.2 /100 | #136 | Excellent $56,452 |
| Slavs | 86.5 /100 | #137 | Excellent $56,390 |
| Slovaks | 85.5 /100 | #138 | Excellent $56,306 |
| Zimbabweans | 85.5 /100 | #139 | Excellent $56,302 |
| Luxembourgers | 85.5 /100 | #140 | Excellent $56,300 |
| Danes | 84.8 /100 | #141 | Excellent $56,246 |
| Ethiopians | 84.8 /100 | #142 | Excellent $56,243 |
| Sri Lankans | 83.4 /100 | #143 | Excellent $56,136 |
| Immigrants | Uganda | 82.4 /100 | #144 | Excellent $56,064 |