Immigrants from Ukraine vs Immigrants from Bulgaria Median Female Earnings
COMPARE
Immigrants from Ukraine
Immigrants from Bulgaria
Median Female Earnings
Median Female Earnings Comparison
Immigrants from Ukraine
Immigrants from Bulgaria
$43,069
MEDIAN FEMALE EARNINGS
99.9/ 100
METRIC RATING
63rd/ 347
METRIC RANK
$43,085
MEDIAN FEMALE EARNINGS
99.9/ 100
METRIC RATING
61st/ 347
METRIC RANK
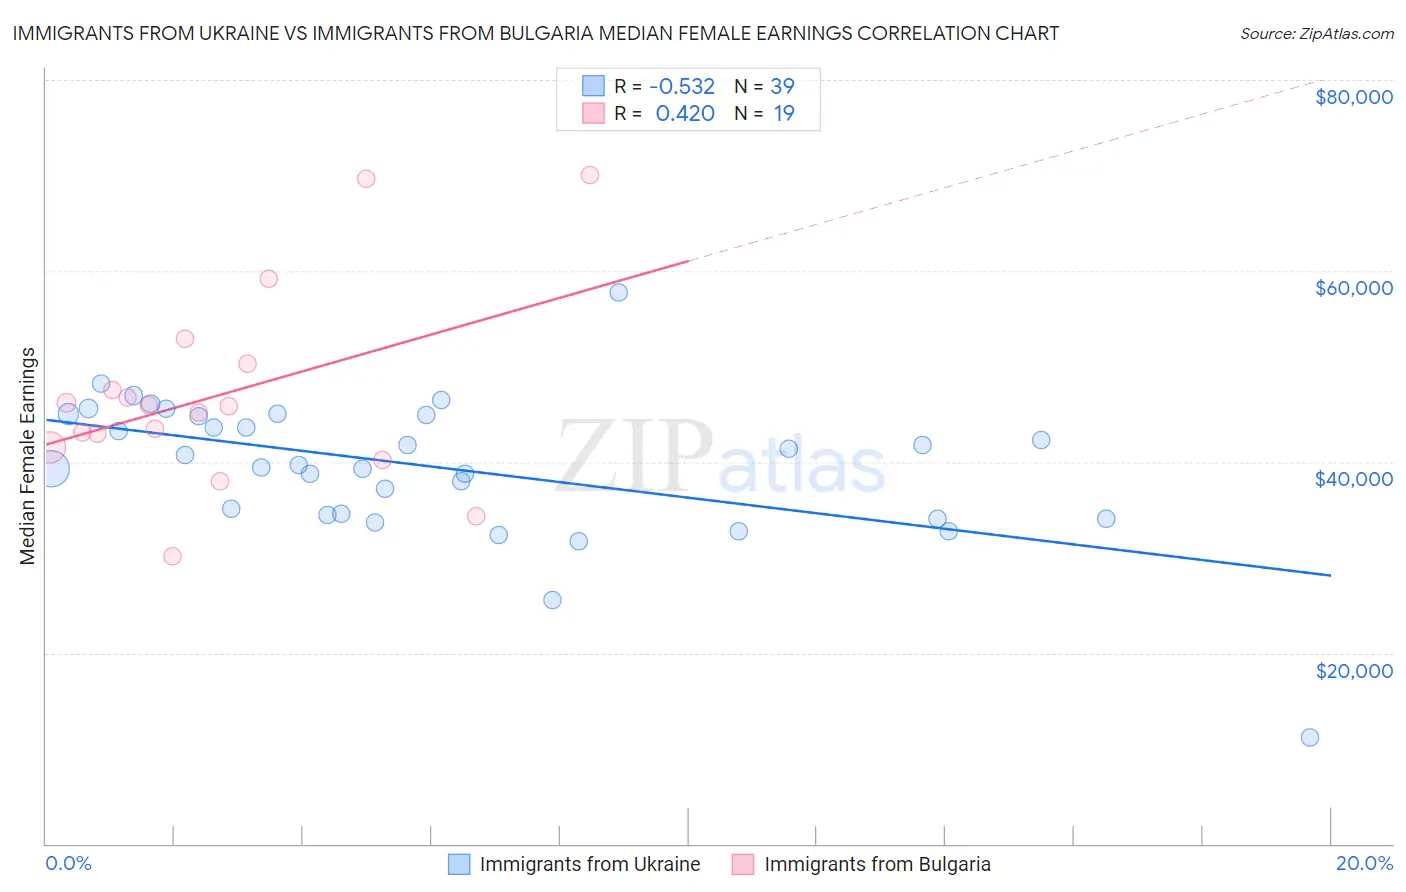
Immigrants from Ukraine vs Immigrants from Bulgaria Median Female Earnings Correlation Chart
The statistical analysis conducted on geographies consisting of 289,632,492 people shows a substantial negative correlation between the proportion of Immigrants from Ukraine and median female earnings in the United States with a correlation coefficient (R) of -0.532 and weighted average of $43,069. Similarly, the statistical analysis conducted on geographies consisting of 172,533,051 people shows a moderate positive correlation between the proportion of Immigrants from Bulgaria and median female earnings in the United States with a correlation coefficient (R) of 0.420 and weighted average of $43,085, a difference of 0.040%.
Median Female Earnings Correlation Summary
| Measurement | Immigrants from Ukraine | Immigrants from Bulgaria |
| Minimum | $11,071 | $30,131 |
| Maximum | $57,684 | $70,060 |
| Range | $46,613 | $39,929 |
| Mean | $39,415 | $47,007 |
| Median | $39,738 | $45,854 |
| Interquartile 25% (IQ1) | $34,500 | $41,489 |
| Interquartile 75% (IQ3) | $44,923 | $50,302 |
| Interquartile Range (IQR) | $10,424 | $8,813 |
| Standard Deviation (Sample) | $7,597 | $10,260 |
| Standard Deviation (Population) | $7,499 | $9,987 |
Demographics Similar to Immigrants from Ukraine and Immigrants from Bulgaria by Median Female Earnings
In terms of median female earnings, the demographic groups most similar to Immigrants from Ukraine are Afghan ($43,077, a difference of 0.020%), Immigrants from Pakistan ($43,052, a difference of 0.040%), Immigrants from Latvia ($43,099, a difference of 0.070%), Estonian ($43,106, a difference of 0.090%), and Paraguayan ($43,173, a difference of 0.24%). Similarly, the demographic groups most similar to Immigrants from Bulgaria are Afghan ($43,077, a difference of 0.020%), Immigrants from Latvia ($43,099, a difference of 0.030%), Estonian ($43,106, a difference of 0.050%), Immigrants from Pakistan ($43,052, a difference of 0.080%), and Paraguayan ($43,173, a difference of 0.20%).
| Demographics | Rating | Rank | Median Female Earnings |
| Immigrants | Lithuania | 99.9 /100 | #52 | Exceptional $43,317 |
| Immigrants | Eastern Europe | 99.9 /100 | #53 | Exceptional $43,309 |
| Australians | 99.9 /100 | #54 | Exceptional $43,308 |
| Egyptians | 99.9 /100 | #55 | Exceptional $43,305 |
| Immigrants | Croatia | 99.9 /100 | #56 | Exceptional $43,258 |
| Ethiopians | 99.9 /100 | #57 | Exceptional $43,243 |
| Paraguayans | 99.9 /100 | #58 | Exceptional $43,173 |
| Estonians | 99.9 /100 | #59 | Exceptional $43,106 |
| Immigrants | Latvia | 99.9 /100 | #60 | Exceptional $43,099 |
| Immigrants | Bulgaria | 99.9 /100 | #61 | Exceptional $43,085 |
| Afghans | 99.9 /100 | #62 | Exceptional $43,077 |
| Immigrants | Ukraine | 99.9 /100 | #63 | Exceptional $43,069 |
| Immigrants | Pakistan | 99.9 /100 | #64 | Exceptional $43,052 |
| Sierra Leoneans | 99.9 /100 | #65 | Exceptional $42,868 |
| Immigrants | Norway | 99.9 /100 | #66 | Exceptional $42,837 |
| Immigrants | Egypt | 99.9 /100 | #67 | Exceptional $42,837 |
| Immigrants | Austria | 99.8 /100 | #68 | Exceptional $42,824 |
| Immigrants | Spain | 99.8 /100 | #69 | Exceptional $42,815 |
| Immigrants | Ethiopia | 99.8 /100 | #70 | Exceptional $42,744 |
| Immigrants | Romania | 99.8 /100 | #71 | Exceptional $42,718 |
| Albanians | 99.8 /100 | #72 | Exceptional $42,584 |