Immigrants from Uganda vs Samoan Median Household Income
COMPARE
Immigrants from Uganda
Samoan
Median Household Income
Median Household Income Comparison
Immigrants from Uganda
Samoans
$87,553
MEDIAN HOUSEHOLD INCOME
82.8/ 100
METRIC RATING
146th/ 347
METRIC RANK
$86,498
MEDIAN HOUSEHOLD INCOME
71.0/ 100
METRIC RATING
157th/ 347
METRIC RANK
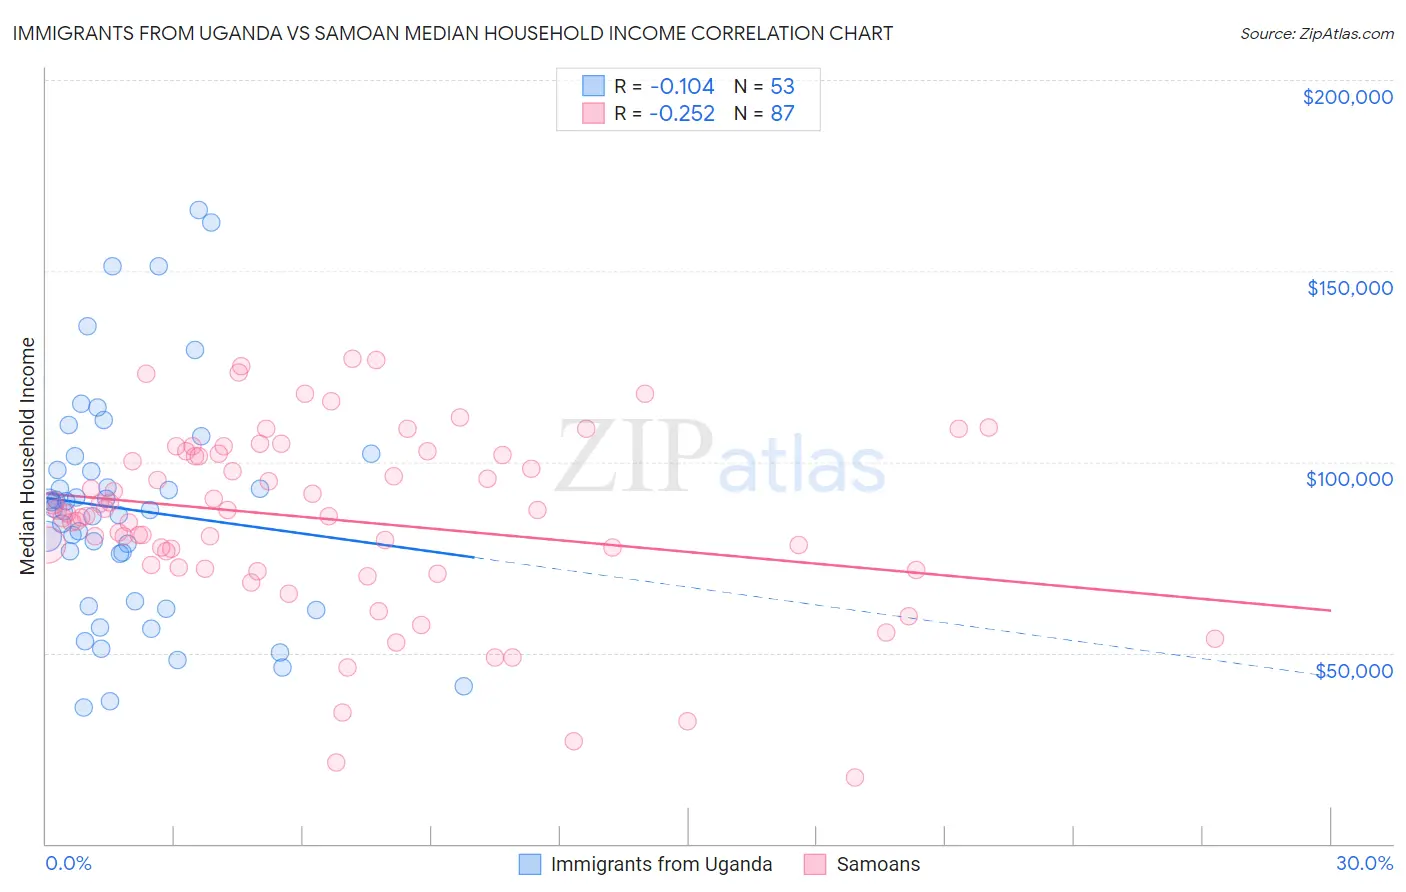
Immigrants from Uganda vs Samoan Median Household Income Correlation Chart
The statistical analysis conducted on geographies consisting of 125,950,023 people shows a poor negative correlation between the proportion of Immigrants from Uganda and median household income in the United States with a correlation coefficient (R) of -0.104 and weighted average of $87,553. Similarly, the statistical analysis conducted on geographies consisting of 225,063,012 people shows a weak negative correlation between the proportion of Samoans and median household income in the United States with a correlation coefficient (R) of -0.252 and weighted average of $86,498, a difference of 1.2%.
Median Household Income Correlation Summary
| Measurement | Immigrants from Uganda | Samoan |
| Minimum | $35,519 | $17,452 |
| Maximum | $166,111 | $127,143 |
| Range | $130,592 | $109,691 |
| Mean | $87,480 | $84,959 |
| Median | $87,386 | $86,491 |
| Interquartile 25% (IQ1) | $62,932 | $72,428 |
| Interquartile 75% (IQ3) | $99,670 | $101,996 |
| Interquartile Range (IQR) | $36,738 | $29,568 |
| Standard Deviation (Sample) | $30,184 | $23,715 |
| Standard Deviation (Population) | $29,898 | $23,578 |
Demographics Similar to Immigrants from Uganda and Samoans by Median Household Income
In terms of median household income, the demographic groups most similar to Immigrants from Uganda are Ugandan ($87,557, a difference of 0.0%), Serbian ($87,572, a difference of 0.020%), South American Indian ($87,446, a difference of 0.12%), Danish ($87,676, a difference of 0.14%), and Canadian ($87,769, a difference of 0.25%). Similarly, the demographic groups most similar to Samoans are Immigrants from Albania ($86,534, a difference of 0.040%), Moroccan ($86,468, a difference of 0.040%), Immigrants from Uzbekistan ($86,425, a difference of 0.080%), Luxembourger ($86,418, a difference of 0.090%), and Slavic ($86,398, a difference of 0.12%).
| Demographics | Rating | Rank | Median Household Income |
| Immigrants | Morocco | 86.0 /100 | #141 | Excellent $87,930 |
| Canadians | 84.7 /100 | #142 | Excellent $87,769 |
| Danes | 83.9 /100 | #143 | Excellent $87,676 |
| Serbians | 83.0 /100 | #144 | Excellent $87,572 |
| Ugandans | 82.9 /100 | #145 | Excellent $87,557 |
| Immigrants | Uganda | 82.8 /100 | #146 | Excellent $87,553 |
| South American Indians | 81.8 /100 | #147 | Excellent $87,446 |
| Costa Ricans | 80.0 /100 | #148 | Excellent $87,262 |
| Immigrants | Nepal | 77.7 /100 | #149 | Good $87,046 |
| Basques | 77.2 /100 | #150 | Good $87,001 |
| Hungarians | 76.3 /100 | #151 | Good $86,920 |
| Immigrants | Saudi Arabia | 75.8 /100 | #152 | Good $86,875 |
| South Americans | 75.1 /100 | #153 | Good $86,824 |
| Immigrants | Germany | 74.4 /100 | #154 | Good $86,764 |
| Carpatho Rusyns | 72.8 /100 | #155 | Good $86,635 |
| Immigrants | Albania | 71.5 /100 | #156 | Good $86,534 |
| Samoans | 71.0 /100 | #157 | Good $86,498 |
| Moroccans | 70.6 /100 | #158 | Good $86,468 |
| Immigrants | Uzbekistan | 70.1 /100 | #159 | Good $86,425 |
| Luxembourgers | 70.0 /100 | #160 | Good $86,418 |
| Slavs | 69.7 /100 | #161 | Good $86,398 |