Immigrants from Uganda vs British West Indian In Labor Force | Age 30-34
COMPARE
Immigrants from Uganda
British West Indian
In Labor Force | Age 30-34
In Labor Force | Age 30-34 Comparison
Immigrants from Uganda
British West Indians
85.2%
IN LABOR FORCE | AGE 30-34
97.2/ 100
METRIC RATING
98th/ 347
METRIC RANK
84.0%
IN LABOR FORCE | AGE 30-34
0.8/ 100
METRIC RATING
247th/ 347
METRIC RANK
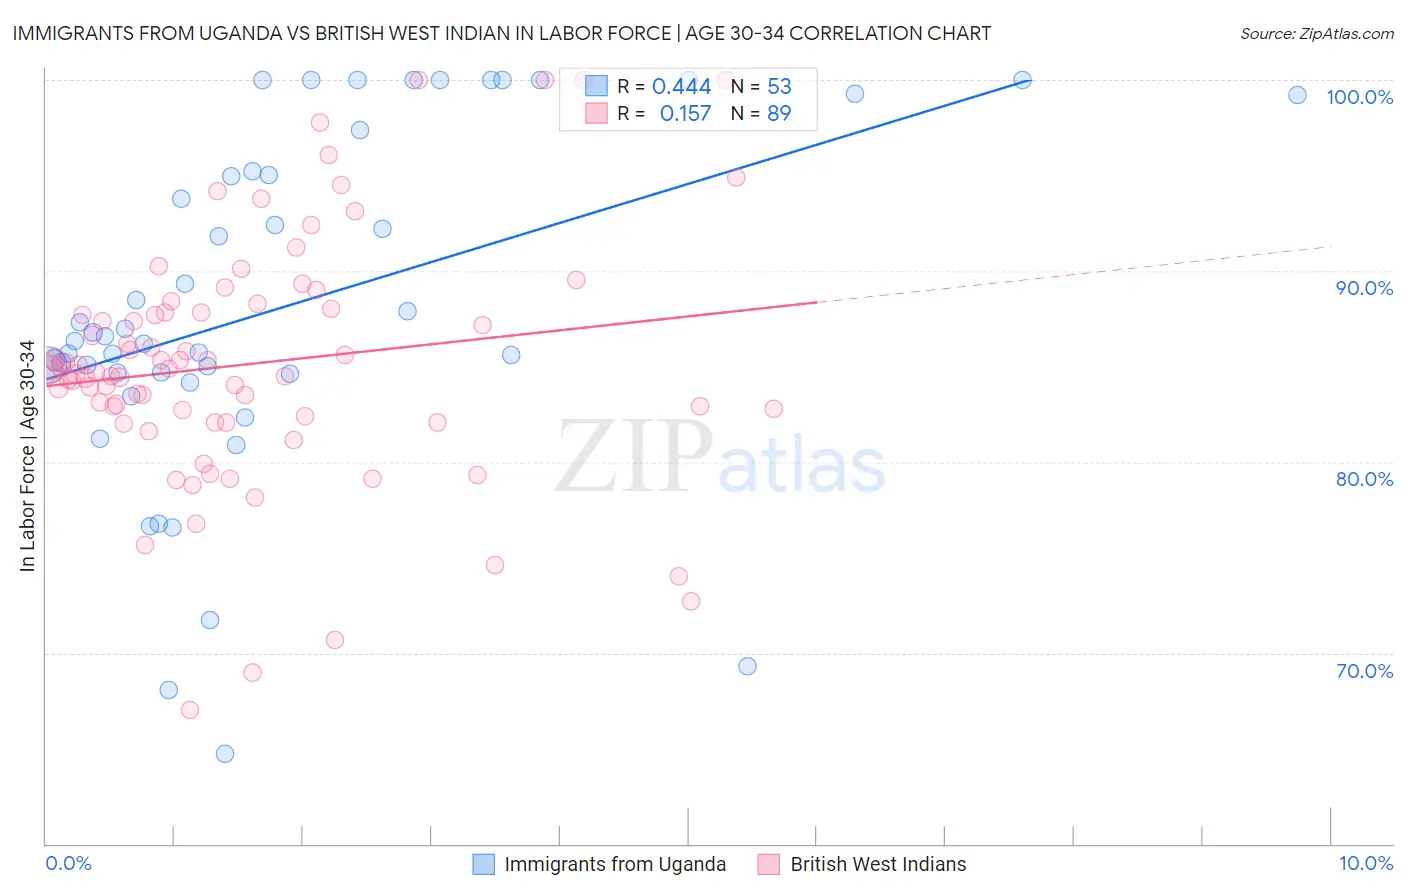
Immigrants from Uganda vs British West Indian In Labor Force | Age 30-34 Correlation Chart
The statistical analysis conducted on geographies consisting of 125,970,881 people shows a moderate positive correlation between the proportion of Immigrants from Uganda and labor force participation rate among population between the ages 30 and 34 in the United States with a correlation coefficient (R) of 0.444 and weighted average of 85.2%. Similarly, the statistical analysis conducted on geographies consisting of 152,639,615 people shows a poor positive correlation between the proportion of British West Indians and labor force participation rate among population between the ages 30 and 34 in the United States with a correlation coefficient (R) of 0.157 and weighted average of 84.0%, a difference of 1.5%.
In Labor Force | Age 30-34 Correlation Summary
| Measurement | Immigrants from Uganda | British West Indian |
| Minimum | 64.7% | 67.0% |
| Maximum | 100.0% | 100.0% |
| Range | 35.3% | 33.0% |
| Mean | 88.2% | 85.1% |
| Median | 86.6% | 84.9% |
| Interquartile 25% (IQ1) | 84.6% | 82.2% |
| Interquartile 75% (IQ3) | 96.3% | 87.9% |
| Interquartile Range (IQR) | 11.7% | 5.7% |
| Standard Deviation (Sample) | 9.0% | 6.4% |
| Standard Deviation (Population) | 8.9% | 6.4% |
Similar Demographics by In Labor Force | Age 30-34
Demographics Similar to Immigrants from Uganda by In Labor Force | Age 30-34
In terms of in labor force | age 30-34, the demographic groups most similar to Immigrants from Uganda are Immigrants from Korea (85.2%, a difference of 0.0%), Thai (85.2%, a difference of 0.0%), Belgian (85.2%, a difference of 0.0%), Sudanese (85.2%, a difference of 0.010%), and Swedish (85.2%, a difference of 0.020%).
| Demographics | Rating | Rank | In Labor Force | Age 30-34 |
| Immigrants | Moldova | 97.9 /100 | #91 | Exceptional 85.3% |
| German Russians | 97.7 /100 | #92 | Exceptional 85.2% |
| Immigrants | Norway | 97.6 /100 | #93 | Exceptional 85.2% |
| Swedes | 97.5 /100 | #94 | Exceptional 85.2% |
| Immigrants | India | 97.4 /100 | #95 | Exceptional 85.2% |
| Immigrants | Korea | 97.3 /100 | #96 | Exceptional 85.2% |
| Thais | 97.2 /100 | #97 | Exceptional 85.2% |
| Immigrants | Uganda | 97.2 /100 | #98 | Exceptional 85.2% |
| Belgians | 97.2 /100 | #99 | Exceptional 85.2% |
| Sudanese | 97.1 /100 | #100 | Exceptional 85.2% |
| Immigrants | Belarus | 96.9 /100 | #101 | Exceptional 85.2% |
| Immigrants | Austria | 96.8 /100 | #102 | Exceptional 85.2% |
| Ukrainians | 96.6 /100 | #103 | Exceptional 85.2% |
| Immigrants | Ghana | 96.5 /100 | #104 | Exceptional 85.2% |
| Alsatians | 96.3 /100 | #105 | Exceptional 85.2% |
Demographics Similar to British West Indians by In Labor Force | Age 30-34
In terms of in labor force | age 30-34, the demographic groups most similar to British West Indians are Portuguese (84.0%, a difference of 0.010%), Basque (84.0%, a difference of 0.020%), Immigrants from Venezuela (84.0%, a difference of 0.020%), Central American (84.0%, a difference of 0.020%), and Immigrants from Dominica (84.0%, a difference of 0.020%).
| Demographics | Rating | Rank | In Labor Force | Age 30-34 |
| Venezuelans | 1.3 /100 | #240 | Tragic 84.0% |
| Immigrants | Portugal | 1.2 /100 | #241 | Tragic 84.0% |
| Immigrants | Oceania | 1.1 /100 | #242 | Tragic 84.0% |
| Immigrants | Caribbean | 1.1 /100 | #243 | Tragic 84.0% |
| Basques | 0.9 /100 | #244 | Tragic 84.0% |
| Immigrants | Venezuela | 0.9 /100 | #245 | Tragic 84.0% |
| Central Americans | 0.9 /100 | #246 | Tragic 84.0% |
| British West Indians | 0.8 /100 | #247 | Tragic 84.0% |
| Portuguese | 0.8 /100 | #248 | Tragic 84.0% |
| Immigrants | Dominica | 0.7 /100 | #249 | Tragic 84.0% |
| Immigrants | Iraq | 0.7 /100 | #250 | Tragic 83.9% |
| Nicaraguans | 0.6 /100 | #251 | Tragic 83.9% |
| Bahamians | 0.6 /100 | #252 | Tragic 83.9% |
| Immigrants | Nicaragua | 0.6 /100 | #253 | Tragic 83.9% |
| Immigrants | St. Vincent and the Grenadines | 0.5 /100 | #254 | Tragic 83.9% |