Immigrants from Taiwan vs Apache 2nd Grade
COMPARE
Immigrants from Taiwan
Apache
2nd Grade
2nd Grade Comparison
Immigrants from Taiwan
Apache
97.8%
2ND GRADE
31.8/ 100
METRIC RATING
190th/ 347
METRIC RANK
97.9%
2ND GRADE
74.0/ 100
METRIC RATING
149th/ 347
METRIC RANK
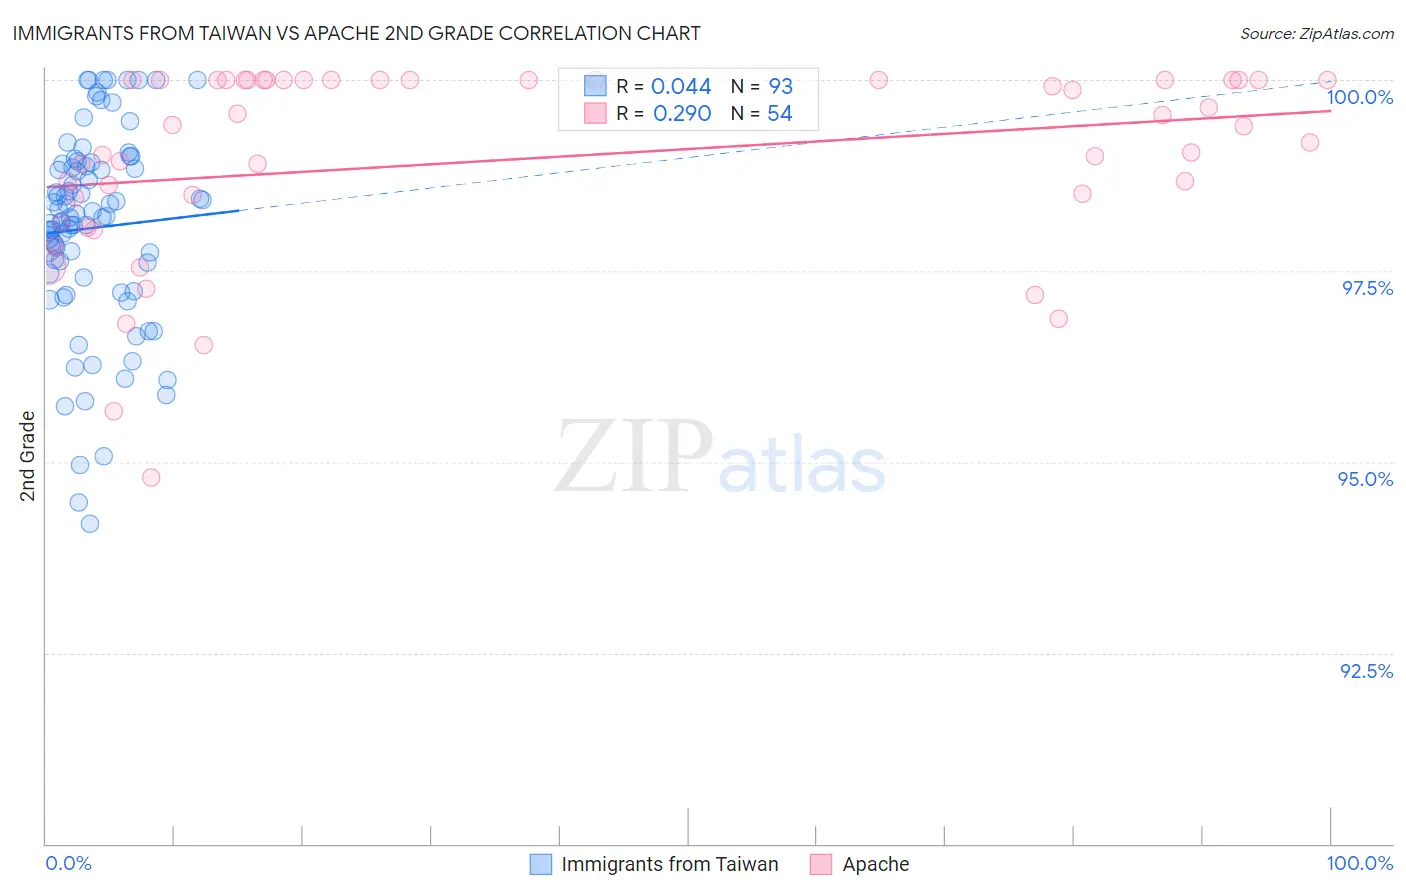
Immigrants from Taiwan vs Apache 2nd Grade Correlation Chart
The statistical analysis conducted on geographies consisting of 298,069,082 people shows no correlation between the proportion of Immigrants from Taiwan and percentage of population with at least 2nd grade education in the United States with a correlation coefficient (R) of 0.044 and weighted average of 97.8%. Similarly, the statistical analysis conducted on geographies consisting of 231,142,814 people shows a weak positive correlation between the proportion of Apache and percentage of population with at least 2nd grade education in the United States with a correlation coefficient (R) of 0.290 and weighted average of 97.9%, a difference of 0.14%.
2nd Grade Correlation Summary
| Measurement | Immigrants from Taiwan | Apache |
| Minimum | 94.2% | 94.8% |
| Maximum | 100.0% | 100.0% |
| Range | 5.8% | 5.2% |
| Mean | 98.1% | 99.0% |
| Median | 98.2% | 99.4% |
| Interquartile 25% (IQ1) | 97.4% | 98.5% |
| Interquartile 75% (IQ3) | 98.9% | 100.0% |
| Interquartile Range (IQR) | 1.4% | 1.5% |
| Standard Deviation (Sample) | 1.3% | 1.3% |
| Standard Deviation (Population) | 1.3% | 1.2% |
Similar Demographics by 2nd Grade
Demographics Similar to Immigrants from Taiwan by 2nd Grade
In terms of 2nd grade, the demographic groups most similar to Immigrants from Taiwan are Paraguayan (97.8%, a difference of 0.0%), Immigrants from Kazakhstan (97.8%, a difference of 0.010%), Panamanian (97.8%, a difference of 0.010%), Black/African American (97.8%, a difference of 0.010%), and Hawaiian (97.8%, a difference of 0.010%).
| Demographics | Rating | Rank | 2nd Grade |
| Immigrants | Poland | 42.2 /100 | #183 | Average 97.8% |
| Immigrants | Belarus | 41.5 /100 | #184 | Average 97.8% |
| Immigrants | Argentina | 40.6 /100 | #185 | Average 97.8% |
| Arabs | 36.9 /100 | #186 | Fair 97.8% |
| Pakistanis | 36.1 /100 | #187 | Fair 97.8% |
| Immigrants | Kazakhstan | 35.6 /100 | #188 | Fair 97.8% |
| Panamanians | 33.5 /100 | #189 | Fair 97.8% |
| Immigrants | Taiwan | 31.8 /100 | #190 | Fair 97.8% |
| Paraguayans | 30.8 /100 | #191 | Fair 97.8% |
| Blacks/African Americans | 29.9 /100 | #192 | Fair 97.8% |
| Hawaiians | 28.5 /100 | #193 | Fair 97.8% |
| Paiute | 27.0 /100 | #194 | Fair 97.8% |
| Mongolians | 26.7 /100 | #195 | Fair 97.8% |
| Immigrants | Kenya | 26.4 /100 | #196 | Fair 97.8% |
| Immigrants | Uganda | 26.3 /100 | #197 | Fair 97.8% |
Demographics Similar to Apache by 2nd Grade
In terms of 2nd grade, the demographic groups most similar to Apache are Jordanian (98.0%, a difference of 0.0%), Immigrants from Moldova (97.9%, a difference of 0.0%), Immigrants from Greece (98.0%, a difference of 0.010%), Soviet Union (97.9%, a difference of 0.010%), and Filipino (98.0%, a difference of 0.020%).
| Demographics | Rating | Rank | 2nd Grade |
| Burmese | 81.0 /100 | #142 | Excellent 98.0% |
| Alsatians | 80.5 /100 | #143 | Excellent 98.0% |
| Hmong | 80.0 /100 | #144 | Good 98.0% |
| Filipinos | 79.2 /100 | #145 | Good 98.0% |
| Immigrants | Israel | 78.0 /100 | #146 | Good 98.0% |
| Immigrants | Greece | 76.8 /100 | #147 | Good 98.0% |
| Jordanians | 74.5 /100 | #148 | Good 98.0% |
| Apache | 74.0 /100 | #149 | Good 97.9% |
| Immigrants | Moldova | 72.9 /100 | #150 | Good 97.9% |
| Soviet Union | 70.7 /100 | #151 | Good 97.9% |
| Immigrants | North Macedonia | 68.5 /100 | #152 | Good 97.9% |
| Immigrants | South Central Asia | 68.3 /100 | #153 | Good 97.9% |
| Marshallese | 67.7 /100 | #154 | Good 97.9% |
| French American Indians | 64.3 /100 | #155 | Good 97.9% |
| Dutch West Indians | 63.8 /100 | #156 | Good 97.9% |