Immigrants from Taiwan vs Tlingit-Haida Median Female Earnings
COMPARE
Immigrants from Taiwan
Tlingit-Haida
Median Female Earnings
Median Female Earnings Comparison
Immigrants from Taiwan
Tlingit-Haida
$49,256
MEDIAN FEMALE EARNINGS
100.0/ 100
METRIC RATING
3rd/ 347
METRIC RANK
$39,513
MEDIAN FEMALE EARNINGS
40.5/ 100
METRIC RATING
182nd/ 347
METRIC RANK
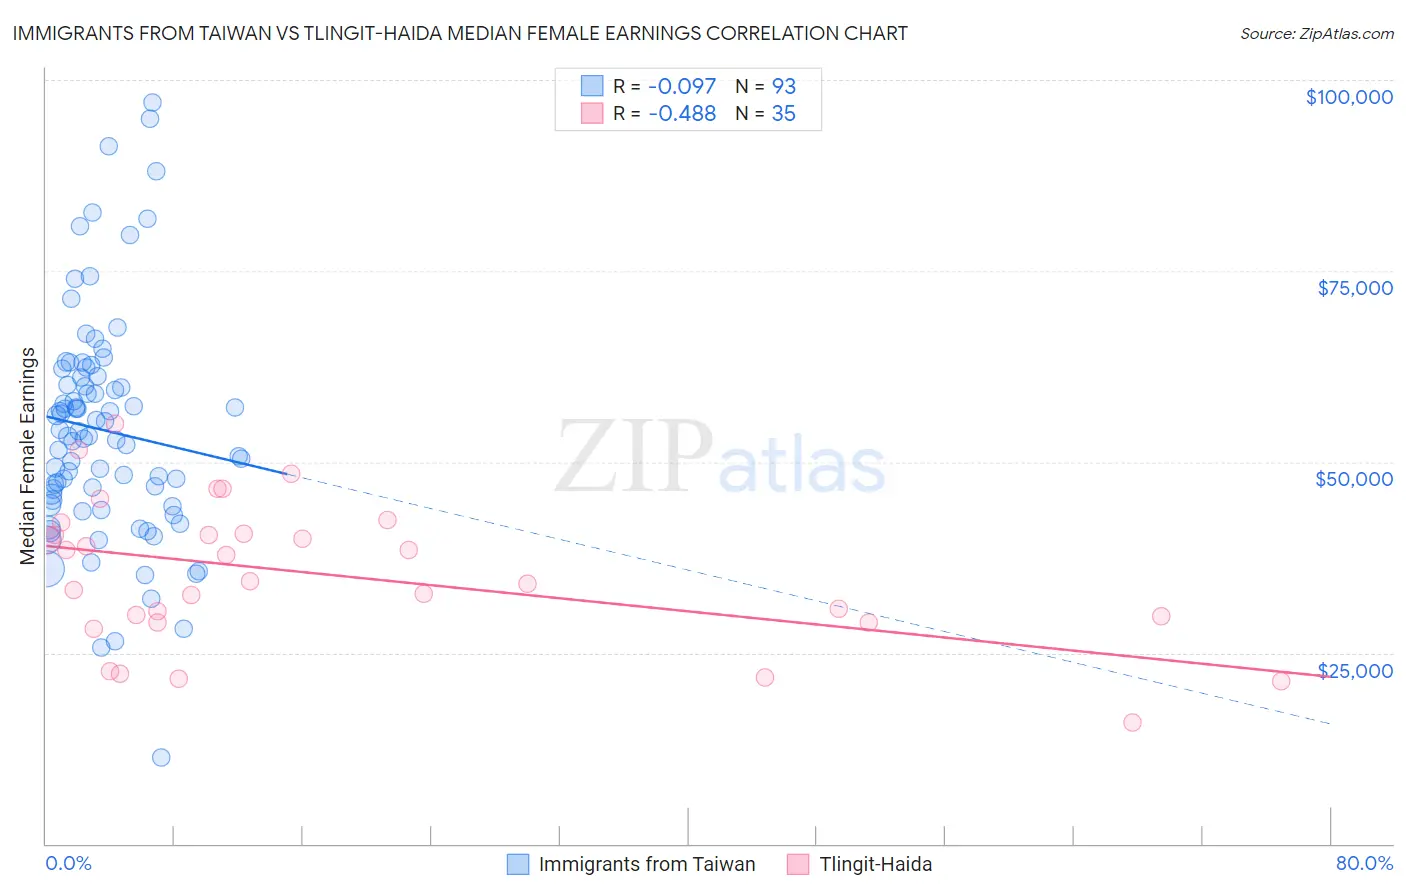
Immigrants from Taiwan vs Tlingit-Haida Median Female Earnings Correlation Chart
The statistical analysis conducted on geographies consisting of 298,206,550 people shows a slight negative correlation between the proportion of Immigrants from Taiwan and median female earnings in the United States with a correlation coefficient (R) of -0.097 and weighted average of $49,256. Similarly, the statistical analysis conducted on geographies consisting of 60,850,593 people shows a moderate negative correlation between the proportion of Tlingit-Haida and median female earnings in the United States with a correlation coefficient (R) of -0.488 and weighted average of $39,513, a difference of 24.7%.
Median Female Earnings Correlation Summary
| Measurement | Immigrants from Taiwan | Tlingit-Haida |
| Minimum | $11,250 | $15,833 |
| Maximum | $97,064 | $55,000 |
| Range | $85,814 | $39,167 |
| Mean | $54,143 | $35,190 |
| Median | $53,398 | $34,397 |
| Interquartile 25% (IQ1) | $44,696 | $28,977 |
| Interquartile 75% (IQ3) | $61,160 | $40,590 |
| Interquartile Range (IQR) | $16,465 | $11,613 |
| Standard Deviation (Sample) | $14,938 | $9,336 |
| Standard Deviation (Population) | $14,857 | $9,202 |
Similar Demographics by Median Female Earnings
Demographics Similar to Immigrants from Taiwan by Median Female Earnings
In terms of median female earnings, the demographic groups most similar to Immigrants from Taiwan are Filipino ($49,508, a difference of 0.51%), Immigrants from Hong Kong ($49,818, a difference of 1.1%), Immigrants from India ($48,292, a difference of 2.0%), Immigrants from Singapore ($47,986, a difference of 2.6%), and Immigrants from Ireland ($47,598, a difference of 3.5%).
| Demographics | Rating | Rank | Median Female Earnings |
| Immigrants | Hong Kong | 100.0 /100 | #1 | Exceptional $49,818 |
| Filipinos | 100.0 /100 | #2 | Exceptional $49,508 |
| Immigrants | Taiwan | 100.0 /100 | #3 | Exceptional $49,256 |
| Immigrants | India | 100.0 /100 | #4 | Exceptional $48,292 |
| Immigrants | Singapore | 100.0 /100 | #5 | Exceptional $47,986 |
| Immigrants | Ireland | 100.0 /100 | #6 | Exceptional $47,598 |
| Thais | 100.0 /100 | #7 | Exceptional $47,577 |
| Iranians | 100.0 /100 | #8 | Exceptional $47,421 |
| Immigrants | Iran | 100.0 /100 | #9 | Exceptional $47,154 |
| Immigrants | China | 100.0 /100 | #10 | Exceptional $46,972 |
| Okinawans | 100.0 /100 | #11 | Exceptional $46,905 |
| Immigrants | Israel | 100.0 /100 | #12 | Exceptional $46,902 |
| Immigrants | Australia | 100.0 /100 | #13 | Exceptional $46,573 |
| Soviet Union | 100.0 /100 | #14 | Exceptional $46,556 |
| Immigrants | Eastern Asia | 100.0 /100 | #15 | Exceptional $46,502 |
Demographics Similar to Tlingit-Haida by Median Female Earnings
In terms of median female earnings, the demographic groups most similar to Tlingit-Haida are Hungarian ($39,510, a difference of 0.010%), Tsimshian ($39,530, a difference of 0.050%), Immigrants from Kenya ($39,535, a difference of 0.060%), European ($39,457, a difference of 0.14%), and Immigrants from West Indies ($39,441, a difference of 0.18%).
| Demographics | Rating | Rank | Median Female Earnings |
| Immigrants | South America | 47.2 /100 | #175 | Average $39,643 |
| Nigerians | 47.0 /100 | #176 | Average $39,641 |
| Costa Ricans | 46.1 /100 | #177 | Average $39,622 |
| Slavs | 45.6 /100 | #178 | Average $39,613 |
| Immigrants | Germany | 45.1 /100 | #179 | Average $39,603 |
| Immigrants | Kenya | 41.6 /100 | #180 | Average $39,535 |
| Tsimshian | 41.4 /100 | #181 | Average $39,530 |
| Tlingit-Haida | 40.5 /100 | #182 | Average $39,513 |
| Hungarians | 40.3 /100 | #183 | Average $39,510 |
| Europeans | 37.7 /100 | #184 | Fair $39,457 |
| Immigrants | West Indies | 36.9 /100 | #185 | Fair $39,441 |
| Colombians | 36.9 /100 | #186 | Fair $39,439 |
| Swedes | 36.0 /100 | #187 | Fair $39,421 |
| Bermudans | 35.9 /100 | #188 | Fair $39,418 |
| Senegalese | 34.2 /100 | #189 | Fair $39,384 |