Immigrants from Germany vs Somali Median Earnings
COMPARE
Immigrants from Germany
Somali
Median Earnings
Median Earnings Comparison
Immigrants from Germany
Somalis
$47,566
MEDIAN EARNINGS
83.1/ 100
METRIC RATING
152nd/ 347
METRIC RANK
$43,567
MEDIAN EARNINGS
1.8/ 100
METRIC RATING
253rd/ 347
METRIC RANK
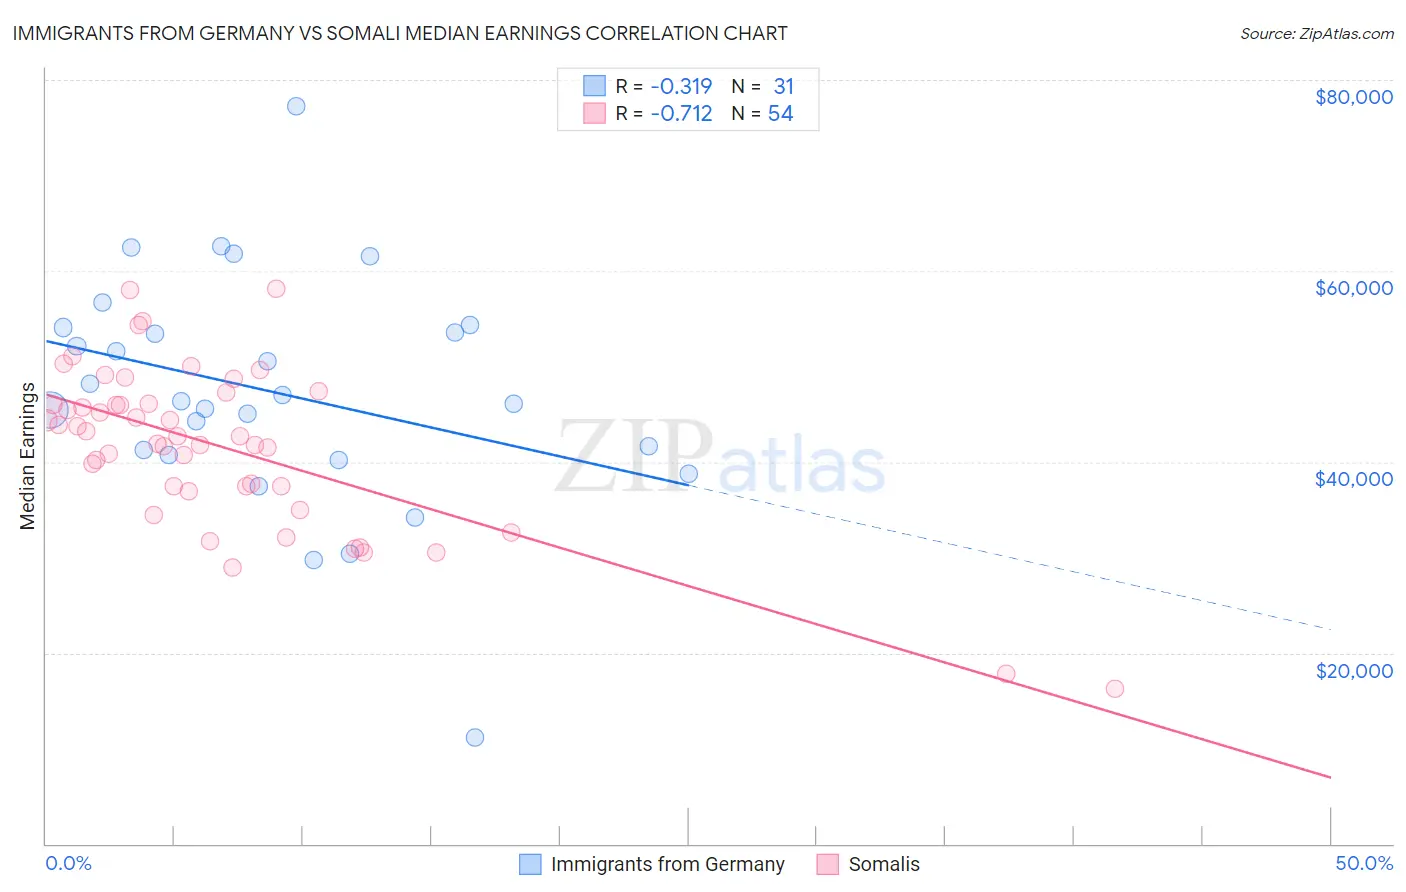
Immigrants from Germany vs Somali Median Earnings Correlation Chart
The statistical analysis conducted on geographies consisting of 463,817,606 people shows a mild negative correlation between the proportion of Immigrants from Germany and median earnings in the United States with a correlation coefficient (R) of -0.319 and weighted average of $47,566. Similarly, the statistical analysis conducted on geographies consisting of 99,321,613 people shows a strong negative correlation between the proportion of Somalis and median earnings in the United States with a correlation coefficient (R) of -0.712 and weighted average of $43,567, a difference of 9.2%.
Median Earnings Correlation Summary
| Measurement | Immigrants from Germany | Somali |
| Minimum | $11,184 | $16,214 |
| Maximum | $77,202 | $58,125 |
| Range | $66,018 | $41,911 |
| Mean | $47,273 | $41,593 |
| Median | $46,327 | $42,677 |
| Interquartile 25% (IQ1) | $40,729 | $37,388 |
| Interquartile 75% (IQ3) | $54,030 | $46,056 |
| Interquartile Range (IQR) | $13,301 | $8,668 |
| Standard Deviation (Sample) | $12,257 | $8,542 |
| Standard Deviation (Population) | $12,057 | $8,463 |
Similar Demographics by Median Earnings
Demographics Similar to Immigrants from Germany by Median Earnings
In terms of median earnings, the demographic groups most similar to Immigrants from Germany are Immigrants from Oceania ($47,617, a difference of 0.11%), Peruvian ($47,628, a difference of 0.13%), Luxembourger ($47,640, a difference of 0.16%), Immigrants from Eritrea ($47,657, a difference of 0.19%), and Slavic ($47,470, a difference of 0.20%).
| Demographics | Rating | Rank | Median Earnings |
| Immigrants | Saudi Arabia | 85.6 /100 | #145 | Excellent $47,704 |
| Immigrants | Chile | 85.5 /100 | #146 | Excellent $47,697 |
| Immigrants | South Eastern Asia | 85.0 /100 | #147 | Excellent $47,671 |
| Immigrants | Eritrea | 84.8 /100 | #148 | Excellent $47,657 |
| Luxembourgers | 84.5 /100 | #149 | Excellent $47,640 |
| Peruvians | 84.2 /100 | #150 | Excellent $47,628 |
| Immigrants | Oceania | 84.1 /100 | #151 | Excellent $47,617 |
| Immigrants | Germany | 83.1 /100 | #152 | Excellent $47,566 |
| Slavs | 81.1 /100 | #153 | Excellent $47,470 |
| Immigrants | Portugal | 77.3 /100 | #154 | Good $47,304 |
| Immigrants | Vietnam | 76.7 /100 | #155 | Good $47,282 |
| Irish | 76.6 /100 | #156 | Good $47,276 |
| Czechs | 75.1 /100 | #157 | Good $47,221 |
| Slovaks | 71.7 /100 | #158 | Good $47,095 |
| Immigrants | Peru | 69.6 /100 | #159 | Good $47,025 |
Demographics Similar to Somalis by Median Earnings
In terms of median earnings, the demographic groups most similar to Somalis are Liberian ($43,536, a difference of 0.070%), Hawaiian ($43,673, a difference of 0.24%), Tsimshian ($43,695, a difference of 0.30%), Immigrants from Middle Africa ($43,416, a difference of 0.35%), and Alaskan Athabascan ($43,393, a difference of 0.40%).
| Demographics | Rating | Rank | Median Earnings |
| Immigrants | West Indies | 3.1 /100 | #246 | Tragic $43,989 |
| Immigrants | Cabo Verde | 3.0 /100 | #247 | Tragic $43,963 |
| Nepalese | 2.6 /100 | #248 | Tragic $43,860 |
| Malaysians | 2.6 /100 | #249 | Tragic $43,844 |
| Alaska Natives | 2.3 /100 | #250 | Tragic $43,750 |
| Tsimshian | 2.1 /100 | #251 | Tragic $43,695 |
| Hawaiians | 2.0 /100 | #252 | Tragic $43,673 |
| Somalis | 1.8 /100 | #253 | Tragic $43,567 |
| Liberians | 1.7 /100 | #254 | Tragic $43,536 |
| Immigrants | Middle Africa | 1.4 /100 | #255 | Tragic $43,416 |
| Alaskan Athabascans | 1.4 /100 | #256 | Tragic $43,393 |
| Jamaicans | 1.3 /100 | #257 | Tragic $43,343 |
| French American Indians | 1.3 /100 | #258 | Tragic $43,333 |
| German Russians | 1.1 /100 | #259 | Tragic $43,200 |
| Immigrants | Somalia | 0.9 /100 | #260 | Tragic $43,100 |