Nonimmigrants vs Somali Median Earnings
COMPARE
Nonimmigrants
Somali
Median Earnings
Median Earnings Comparison
Nonimmigrants
Somalis
$44,117
MEDIAN EARNINGS
3.7/ 100
METRIC RATING
244th/ 347
METRIC RANK
$43,567
MEDIAN EARNINGS
1.8/ 100
METRIC RATING
253rd/ 347
METRIC RANK
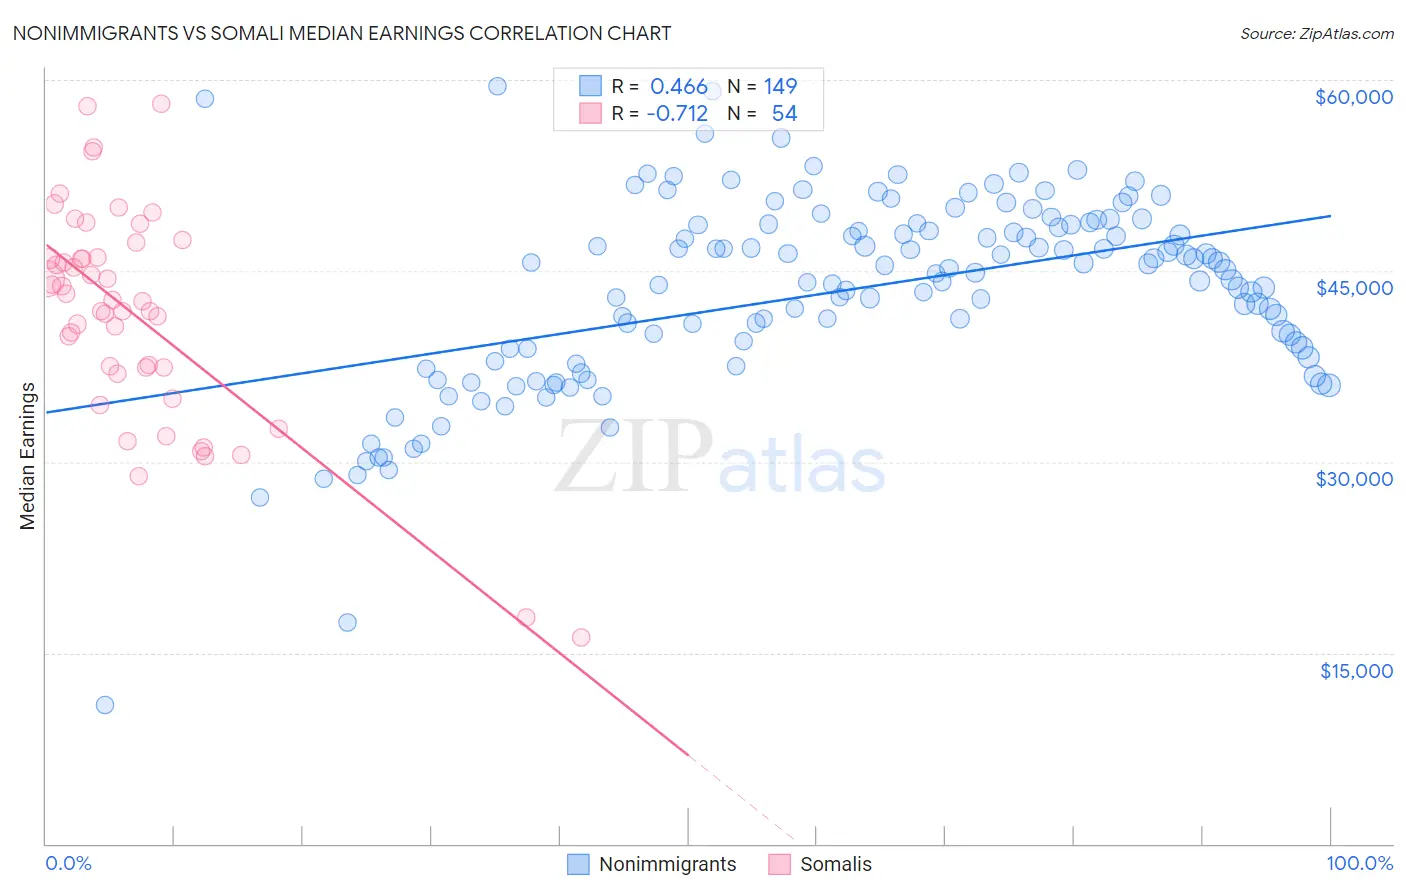
Nonimmigrants vs Somali Median Earnings Correlation Chart
The statistical analysis conducted on geographies consisting of 583,813,496 people shows a moderate positive correlation between the proportion of Nonimmigrants and median earnings in the United States with a correlation coefficient (R) of 0.466 and weighted average of $44,117. Similarly, the statistical analysis conducted on geographies consisting of 99,321,613 people shows a strong negative correlation between the proportion of Somalis and median earnings in the United States with a correlation coefficient (R) of -0.712 and weighted average of $43,567, a difference of 1.3%.
Median Earnings Correlation Summary
| Measurement | Nonimmigrants | Somali |
| Minimum | $10,941 | $16,214 |
| Maximum | $59,517 | $58,125 |
| Range | $48,576 | $41,911 |
| Mean | $43,445 | $41,593 |
| Median | $45,090 | $42,677 |
| Interquartile 25% (IQ1) | $38,540 | $37,388 |
| Interquartile 75% (IQ3) | $48,620 | $46,056 |
| Interquartile Range (IQR) | $10,080 | $8,668 |
| Standard Deviation (Sample) | $7,587 | $8,542 |
| Standard Deviation (Population) | $7,562 | $8,463 |
Demographics Similar to Nonimmigrants and Somalis by Median Earnings
In terms of median earnings, the demographic groups most similar to Nonimmigrants are Subsaharan African ($44,118, a difference of 0.0%), Immigrants from Venezuela ($44,163, a difference of 0.10%), Samoan ($44,206, a difference of 0.20%), Immigrants from Burma/Myanmar ($43,998, a difference of 0.27%), and Aleut ($44,241, a difference of 0.28%). Similarly, the demographic groups most similar to Somalis are Liberian ($43,536, a difference of 0.070%), Hawaiian ($43,673, a difference of 0.24%), Tsimshian ($43,695, a difference of 0.30%), Immigrants from Middle Africa ($43,416, a difference of 0.35%), and Alaskan Athabascan ($43,393, a difference of 0.40%).
| Demographics | Rating | Rank | Median Earnings |
| Sudanese | 5.6 /100 | #238 | Tragic $44,419 |
| Senegalese | 5.3 /100 | #239 | Tragic $44,373 |
| Aleuts | 4.4 /100 | #240 | Tragic $44,241 |
| Samoans | 4.2 /100 | #241 | Tragic $44,206 |
| Immigrants | Venezuela | 4.0 /100 | #242 | Tragic $44,163 |
| Sub-Saharan Africans | 3.7 /100 | #243 | Tragic $44,118 |
| Immigrants | Nonimmigrants | 3.7 /100 | #244 | Tragic $44,117 |
| Immigrants | Burma/Myanmar | 3.2 /100 | #245 | Tragic $43,998 |
| Immigrants | West Indies | 3.1 /100 | #246 | Tragic $43,989 |
| Immigrants | Cabo Verde | 3.0 /100 | #247 | Tragic $43,963 |
| Nepalese | 2.6 /100 | #248 | Tragic $43,860 |
| Malaysians | 2.6 /100 | #249 | Tragic $43,844 |
| Alaska Natives | 2.3 /100 | #250 | Tragic $43,750 |
| Tsimshian | 2.1 /100 | #251 | Tragic $43,695 |
| Hawaiians | 2.0 /100 | #252 | Tragic $43,673 |
| Somalis | 1.8 /100 | #253 | Tragic $43,567 |
| Liberians | 1.7 /100 | #254 | Tragic $43,536 |
| Immigrants | Middle Africa | 1.4 /100 | #255 | Tragic $43,416 |
| Alaskan Athabascans | 1.4 /100 | #256 | Tragic $43,393 |
| Jamaicans | 1.3 /100 | #257 | Tragic $43,343 |
| French American Indians | 1.3 /100 | #258 | Tragic $43,333 |