Immigrants from Panama vs Central American Median Earnings
COMPARE
Immigrants from Panama
Central American
Median Earnings
Median Earnings Comparison
Immigrants from Panama
Central Americans
$45,198
MEDIAN EARNINGS
15.0/ 100
METRIC RATING
222nd/ 347
METRIC RANK
$42,280
MEDIAN EARNINGS
0.3/ 100
METRIC RATING
277th/ 347
METRIC RANK
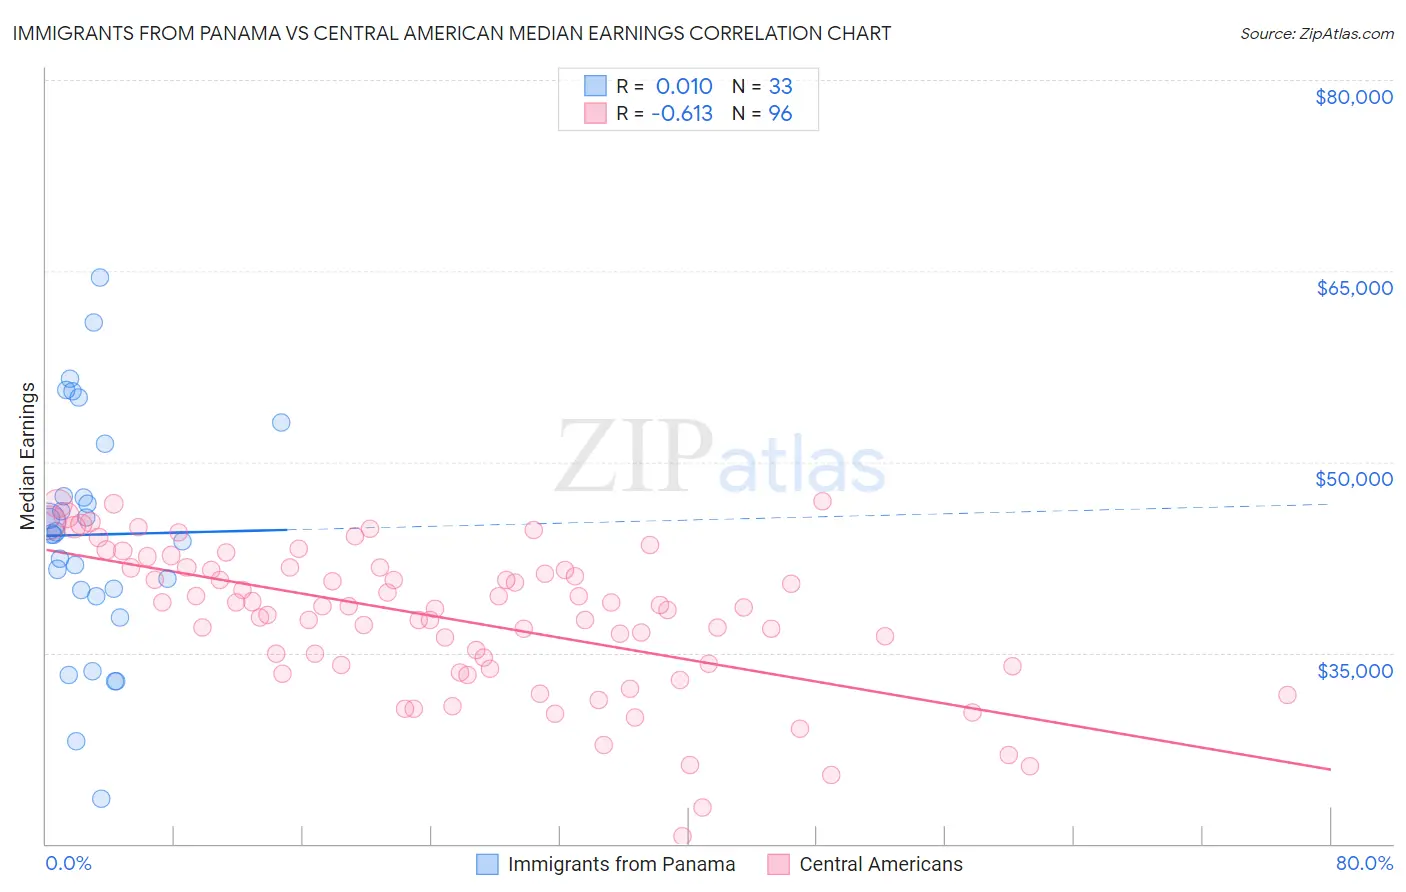
Immigrants from Panama vs Central American Median Earnings Correlation Chart
The statistical analysis conducted on geographies consisting of 221,169,853 people shows no correlation between the proportion of Immigrants from Panama and median earnings in the United States with a correlation coefficient (R) of 0.010 and weighted average of $45,198. Similarly, the statistical analysis conducted on geographies consisting of 504,567,370 people shows a significant negative correlation between the proportion of Central Americans and median earnings in the United States with a correlation coefficient (R) of -0.613 and weighted average of $42,280, a difference of 6.9%.
Median Earnings Correlation Summary
| Measurement | Immigrants from Panama | Central American |
| Minimum | $23,516 | $20,583 |
| Maximum | $64,519 | $46,875 |
| Range | $41,003 | $26,292 |
| Mean | $44,283 | $37,665 |
| Median | $44,355 | $38,592 |
| Interquartile 25% (IQ1) | $39,682 | $34,004 |
| Interquartile 75% (IQ3) | $49,375 | $41,685 |
| Interquartile Range (IQR) | $9,693 | $7,681 |
| Standard Deviation (Sample) | $9,181 | $5,685 |
| Standard Deviation (Population) | $9,041 | $5,655 |
Similar Demographics by Median Earnings
Demographics Similar to Immigrants from Panama by Median Earnings
In terms of median earnings, the demographic groups most similar to Immigrants from Panama are White/Caucasian ($45,197, a difference of 0.0%), Immigrants from Guyana ($45,204, a difference of 0.010%), Ecuadorian ($45,214, a difference of 0.030%), West Indian ($45,132, a difference of 0.15%), and Immigrants from Cambodia ($45,090, a difference of 0.24%).
| Demographics | Rating | Rank | Median Earnings |
| Immigrants | Bangladesh | 22.0 /100 | #215 | Fair $45,532 |
| Guyanese | 20.6 /100 | #216 | Fair $45,470 |
| Tlingit-Haida | 20.5 /100 | #217 | Fair $45,468 |
| Spanish | 19.7 /100 | #218 | Poor $45,432 |
| Dutch | 18.4 /100 | #219 | Poor $45,370 |
| Ecuadorians | 15.3 /100 | #220 | Poor $45,214 |
| Immigrants | Guyana | 15.1 /100 | #221 | Poor $45,204 |
| Immigrants | Panama | 15.0 /100 | #222 | Poor $45,198 |
| Whites/Caucasians | 15.0 /100 | #223 | Poor $45,197 |
| West Indians | 13.9 /100 | #224 | Poor $45,132 |
| Immigrants | Cambodia | 13.2 /100 | #225 | Poor $45,090 |
| Immigrants | Nigeria | 12.2 /100 | #226 | Poor $45,030 |
| Native Hawaiians | 12.2 /100 | #227 | Poor $45,027 |
| Immigrants | Iraq | 11.6 /100 | #228 | Poor $44,988 |
| Scotch-Irish | 10.7 /100 | #229 | Poor $44,924 |
Demographics Similar to Central Americans by Median Earnings
In terms of median earnings, the demographic groups most similar to Central Americans are Spanish American ($42,316, a difference of 0.090%), Immigrants from Belize ($42,339, a difference of 0.14%), Cajun ($42,189, a difference of 0.21%), Colville ($42,151, a difference of 0.31%), and Immigrants from El Salvador ($42,413, a difference of 0.32%).
| Demographics | Rating | Rank | Median Earnings |
| Osage | 0.5 /100 | #270 | Tragic $42,651 |
| Pennsylvania Germans | 0.5 /100 | #271 | Tragic $42,615 |
| Iroquois | 0.4 /100 | #272 | Tragic $42,430 |
| Immigrants | Dominica | 0.4 /100 | #273 | Tragic $42,420 |
| Immigrants | El Salvador | 0.4 /100 | #274 | Tragic $42,413 |
| Immigrants | Belize | 0.3 /100 | #275 | Tragic $42,339 |
| Spanish Americans | 0.3 /100 | #276 | Tragic $42,316 |
| Central Americans | 0.3 /100 | #277 | Tragic $42,280 |
| Cajuns | 0.3 /100 | #278 | Tragic $42,189 |
| Colville | 0.2 /100 | #279 | Tragic $42,151 |
| Hmong | 0.2 /100 | #280 | Tragic $42,111 |
| Marshallese | 0.2 /100 | #281 | Tragic $41,969 |
| Africans | 0.2 /100 | #282 | Tragic $41,955 |
| Dominicans | 0.2 /100 | #283 | Tragic $41,864 |
| Blackfeet | 0.2 /100 | #284 | Tragic $41,822 |