Immigrants from Bosnia and Herzegovina vs Central American Median Earnings
COMPARE
Immigrants from Bosnia and Herzegovina
Central American
Median Earnings
Median Earnings Comparison
Immigrants from Bosnia and Herzegovina
Central Americans
$45,600
MEDIAN EARNINGS
23.7/ 100
METRIC RATING
208th/ 347
METRIC RANK
$42,280
MEDIAN EARNINGS
0.3/ 100
METRIC RATING
277th/ 347
METRIC RANK
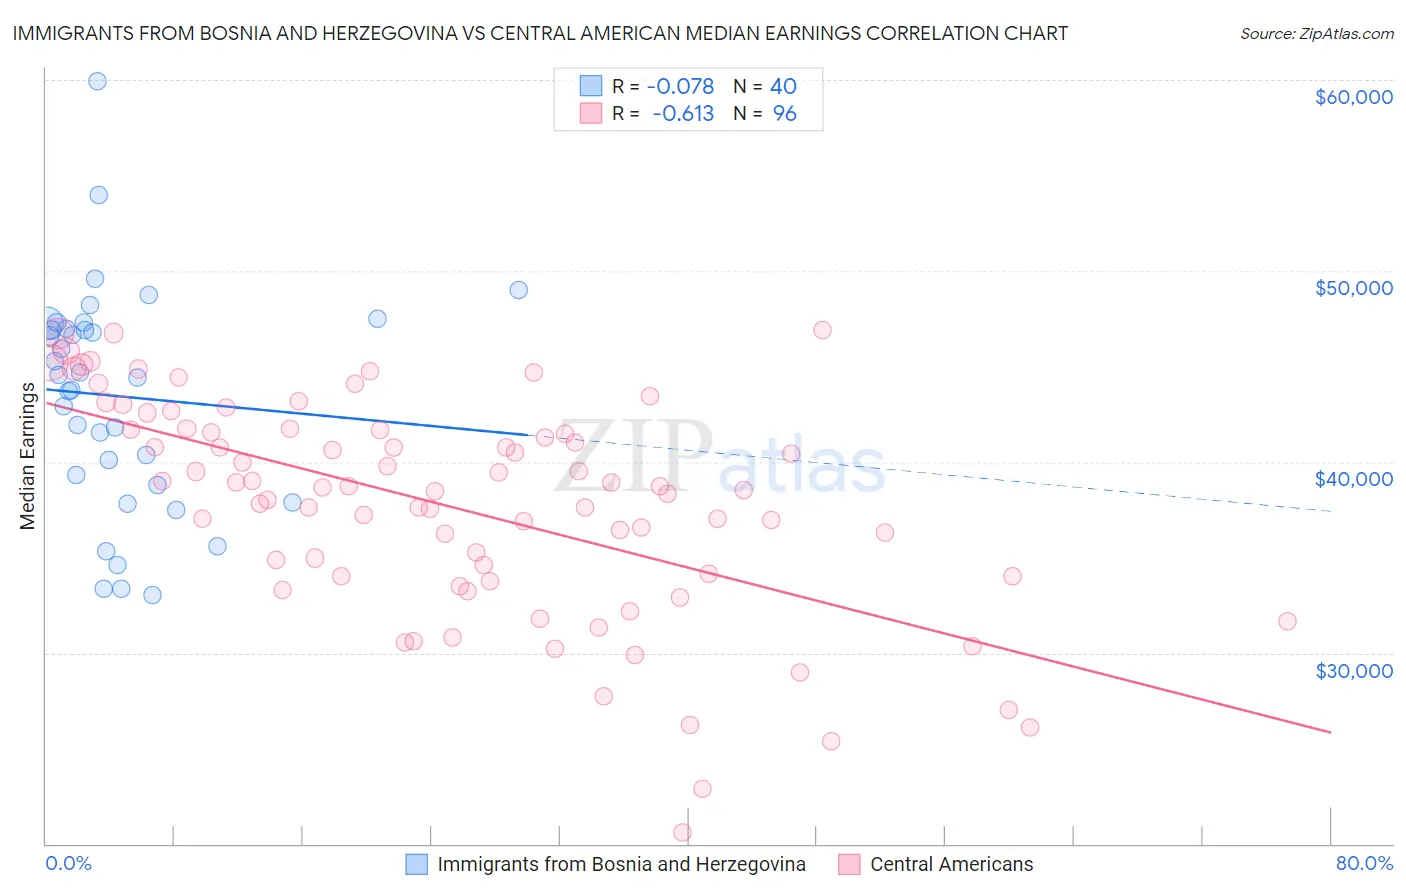
Immigrants from Bosnia and Herzegovina vs Central American Median Earnings Correlation Chart
The statistical analysis conducted on geographies consisting of 156,807,140 people shows a slight negative correlation between the proportion of Immigrants from Bosnia and Herzegovina and median earnings in the United States with a correlation coefficient (R) of -0.078 and weighted average of $45,600. Similarly, the statistical analysis conducted on geographies consisting of 504,567,370 people shows a significant negative correlation between the proportion of Central Americans and median earnings in the United States with a correlation coefficient (R) of -0.613 and weighted average of $42,280, a difference of 7.9%.
Median Earnings Correlation Summary
| Measurement | Immigrants from Bosnia and Herzegovina | Central American |
| Minimum | $33,044 | $20,583 |
| Maximum | $59,938 | $46,875 |
| Range | $26,894 | $26,292 |
| Mean | $43,428 | $37,665 |
| Median | $44,487 | $38,592 |
| Interquartile 25% (IQ1) | $39,026 | $34,004 |
| Interquartile 75% (IQ3) | $47,127 | $41,685 |
| Interquartile Range (IQR) | $8,100 | $7,681 |
| Standard Deviation (Sample) | $5,836 | $5,685 |
| Standard Deviation (Population) | $5,763 | $5,655 |
Similar Demographics by Median Earnings
Demographics Similar to Immigrants from Bosnia and Herzegovina by Median Earnings
In terms of median earnings, the demographic groups most similar to Immigrants from Bosnia and Herzegovina are Immigrants from Thailand ($45,598, a difference of 0.0%), Immigrants from Grenada ($45,596, a difference of 0.010%), Panamanian ($45,593, a difference of 0.010%), Bermudan ($45,593, a difference of 0.010%), and Immigrants from Senegal ($45,611, a difference of 0.020%).
| Demographics | Rating | Rank | Median Earnings |
| Celtics | 27.2 /100 | #201 | Fair $45,732 |
| Immigrants | Trinidad and Tobago | 27.1 /100 | #202 | Fair $45,729 |
| Welsh | 26.6 /100 | #203 | Fair $45,710 |
| Immigrants | Uruguay | 25.9 /100 | #204 | Fair $45,682 |
| Tongans | 25.4 /100 | #205 | Fair $45,665 |
| Immigrants | Ghana | 24.8 /100 | #206 | Fair $45,641 |
| Immigrants | Senegal | 24.0 /100 | #207 | Fair $45,611 |
| Immigrants | Bosnia and Herzegovina | 23.7 /100 | #208 | Fair $45,600 |
| Immigrants | Thailand | 23.7 /100 | #209 | Fair $45,598 |
| Immigrants | Grenada | 23.6 /100 | #210 | Fair $45,596 |
| Panamanians | 23.5 /100 | #211 | Fair $45,593 |
| Bermudans | 23.5 /100 | #212 | Fair $45,593 |
| Immigrants | Colombia | 22.4 /100 | #213 | Fair $45,550 |
| Nigerians | 22.0 /100 | #214 | Fair $45,532 |
| Immigrants | Bangladesh | 22.0 /100 | #215 | Fair $45,532 |
Demographics Similar to Central Americans by Median Earnings
In terms of median earnings, the demographic groups most similar to Central Americans are Spanish American ($42,316, a difference of 0.090%), Immigrants from Belize ($42,339, a difference of 0.14%), Cajun ($42,189, a difference of 0.21%), Colville ($42,151, a difference of 0.31%), and Immigrants from El Salvador ($42,413, a difference of 0.32%).
| Demographics | Rating | Rank | Median Earnings |
| Osage | 0.5 /100 | #270 | Tragic $42,651 |
| Pennsylvania Germans | 0.5 /100 | #271 | Tragic $42,615 |
| Iroquois | 0.4 /100 | #272 | Tragic $42,430 |
| Immigrants | Dominica | 0.4 /100 | #273 | Tragic $42,420 |
| Immigrants | El Salvador | 0.4 /100 | #274 | Tragic $42,413 |
| Immigrants | Belize | 0.3 /100 | #275 | Tragic $42,339 |
| Spanish Americans | 0.3 /100 | #276 | Tragic $42,316 |
| Central Americans | 0.3 /100 | #277 | Tragic $42,280 |
| Cajuns | 0.3 /100 | #278 | Tragic $42,189 |
| Colville | 0.2 /100 | #279 | Tragic $42,151 |
| Hmong | 0.2 /100 | #280 | Tragic $42,111 |
| Marshallese | 0.2 /100 | #281 | Tragic $41,969 |
| Africans | 0.2 /100 | #282 | Tragic $41,955 |
| Dominicans | 0.2 /100 | #283 | Tragic $41,864 |
| Blackfeet | 0.2 /100 | #284 | Tragic $41,822 |