Dutch vs Central American Median Earnings
COMPARE
Dutch
Central American
Median Earnings
Median Earnings Comparison
Dutch
Central Americans
$45,370
MEDIAN EARNINGS
18.4/ 100
METRIC RATING
219th/ 347
METRIC RANK
$42,280
MEDIAN EARNINGS
0.3/ 100
METRIC RATING
277th/ 347
METRIC RANK
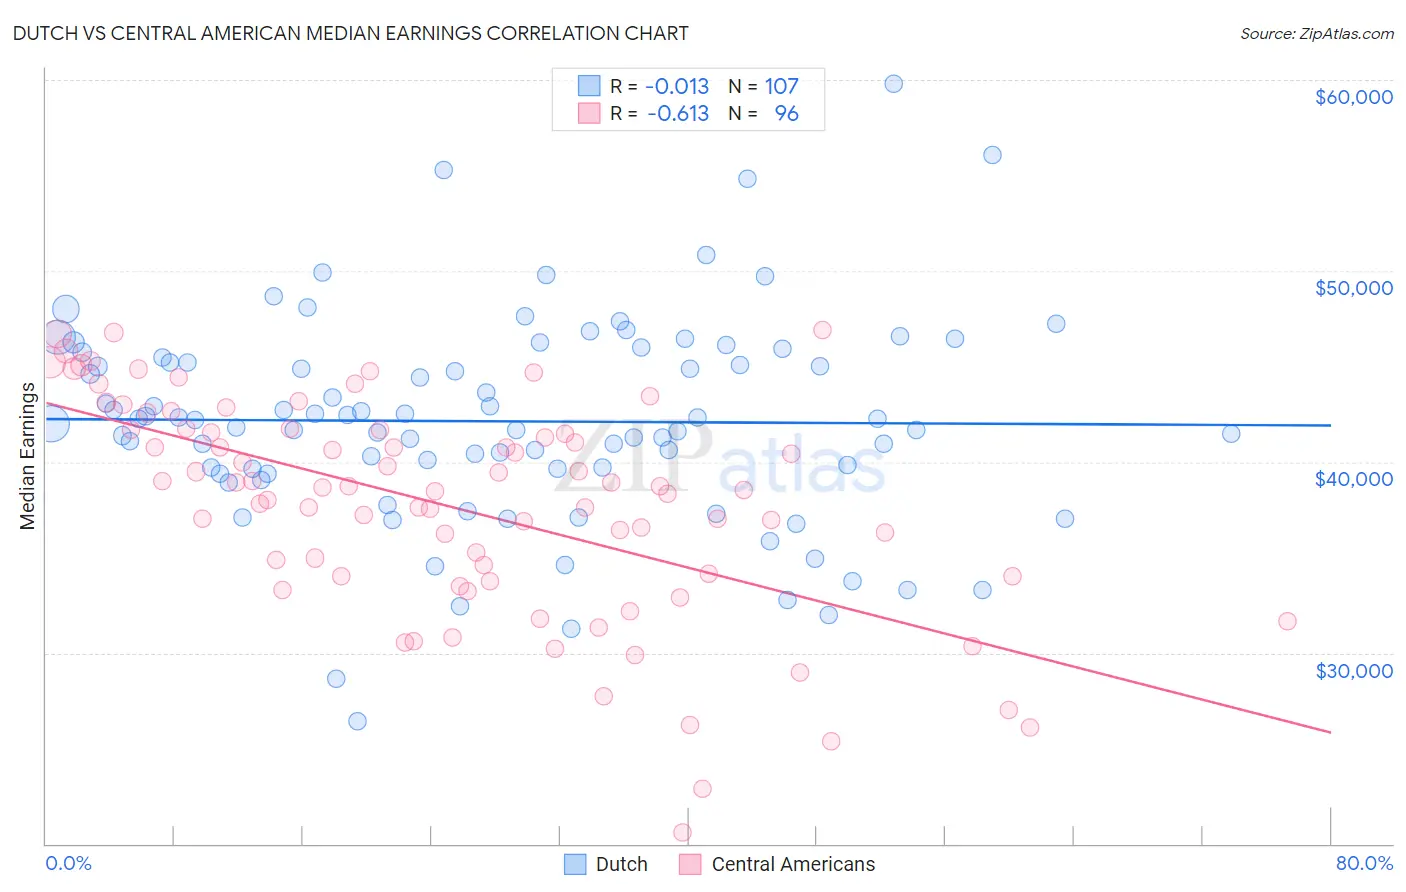
Dutch vs Central American Median Earnings Correlation Chart
The statistical analysis conducted on geographies consisting of 554,077,686 people shows no correlation between the proportion of Dutch and median earnings in the United States with a correlation coefficient (R) of -0.013 and weighted average of $45,370. Similarly, the statistical analysis conducted on geographies consisting of 504,567,370 people shows a significant negative correlation between the proportion of Central Americans and median earnings in the United States with a correlation coefficient (R) of -0.613 and weighted average of $42,280, a difference of 7.3%.
Median Earnings Correlation Summary
| Measurement | Dutch | Central American |
| Minimum | $26,401 | $20,583 |
| Maximum | $59,776 | $46,875 |
| Range | $33,374 | $26,292 |
| Mean | $42,124 | $37,665 |
| Median | $42,201 | $38,592 |
| Interquartile 25% (IQ1) | $39,612 | $34,004 |
| Interquartile 75% (IQ3) | $45,450 | $41,685 |
| Interquartile Range (IQR) | $5,838 | $7,681 |
| Standard Deviation (Sample) | $5,476 | $5,685 |
| Standard Deviation (Population) | $5,450 | $5,655 |
Similar Demographics by Median Earnings
Demographics Similar to Dutch by Median Earnings
In terms of median earnings, the demographic groups most similar to Dutch are Spanish ($45,432, a difference of 0.14%), Guyanese ($45,470, a difference of 0.22%), Tlingit-Haida ($45,468, a difference of 0.22%), Ecuadorian ($45,214, a difference of 0.35%), and Nigerian ($45,532, a difference of 0.36%).
| Demographics | Rating | Rank | Median Earnings |
| Bermudans | 23.5 /100 | #212 | Fair $45,593 |
| Immigrants | Colombia | 22.4 /100 | #213 | Fair $45,550 |
| Nigerians | 22.0 /100 | #214 | Fair $45,532 |
| Immigrants | Bangladesh | 22.0 /100 | #215 | Fair $45,532 |
| Guyanese | 20.6 /100 | #216 | Fair $45,470 |
| Tlingit-Haida | 20.5 /100 | #217 | Fair $45,468 |
| Spanish | 19.7 /100 | #218 | Poor $45,432 |
| Dutch | 18.4 /100 | #219 | Poor $45,370 |
| Ecuadorians | 15.3 /100 | #220 | Poor $45,214 |
| Immigrants | Guyana | 15.1 /100 | #221 | Poor $45,204 |
| Immigrants | Panama | 15.0 /100 | #222 | Poor $45,198 |
| Whites/Caucasians | 15.0 /100 | #223 | Poor $45,197 |
| West Indians | 13.9 /100 | #224 | Poor $45,132 |
| Immigrants | Cambodia | 13.2 /100 | #225 | Poor $45,090 |
| Immigrants | Nigeria | 12.2 /100 | #226 | Poor $45,030 |
Demographics Similar to Central Americans by Median Earnings
In terms of median earnings, the demographic groups most similar to Central Americans are Spanish American ($42,316, a difference of 0.090%), Immigrants from Belize ($42,339, a difference of 0.14%), Cajun ($42,189, a difference of 0.21%), Colville ($42,151, a difference of 0.31%), and Immigrants from El Salvador ($42,413, a difference of 0.32%).
| Demographics | Rating | Rank | Median Earnings |
| Osage | 0.5 /100 | #270 | Tragic $42,651 |
| Pennsylvania Germans | 0.5 /100 | #271 | Tragic $42,615 |
| Iroquois | 0.4 /100 | #272 | Tragic $42,430 |
| Immigrants | Dominica | 0.4 /100 | #273 | Tragic $42,420 |
| Immigrants | El Salvador | 0.4 /100 | #274 | Tragic $42,413 |
| Immigrants | Belize | 0.3 /100 | #275 | Tragic $42,339 |
| Spanish Americans | 0.3 /100 | #276 | Tragic $42,316 |
| Central Americans | 0.3 /100 | #277 | Tragic $42,280 |
| Cajuns | 0.3 /100 | #278 | Tragic $42,189 |
| Colville | 0.2 /100 | #279 | Tragic $42,151 |
| Hmong | 0.2 /100 | #280 | Tragic $42,111 |
| Marshallese | 0.2 /100 | #281 | Tragic $41,969 |
| Africans | 0.2 /100 | #282 | Tragic $41,955 |
| Dominicans | 0.2 /100 | #283 | Tragic $41,864 |
| Blackfeet | 0.2 /100 | #284 | Tragic $41,822 |