Immigrants from Portugal vs Colville Median Family Income
COMPARE
Immigrants from Portugal
Colville
Median Family Income
Median Family Income Comparison
Immigrants from Portugal
Colville
$100,984
MEDIAN FAMILY INCOME
29.6/ 100
METRIC RATING
189th/ 347
METRIC RANK
$85,792
MEDIAN FAMILY INCOME
0.0/ 100
METRIC RATING
301st/ 347
METRIC RANK
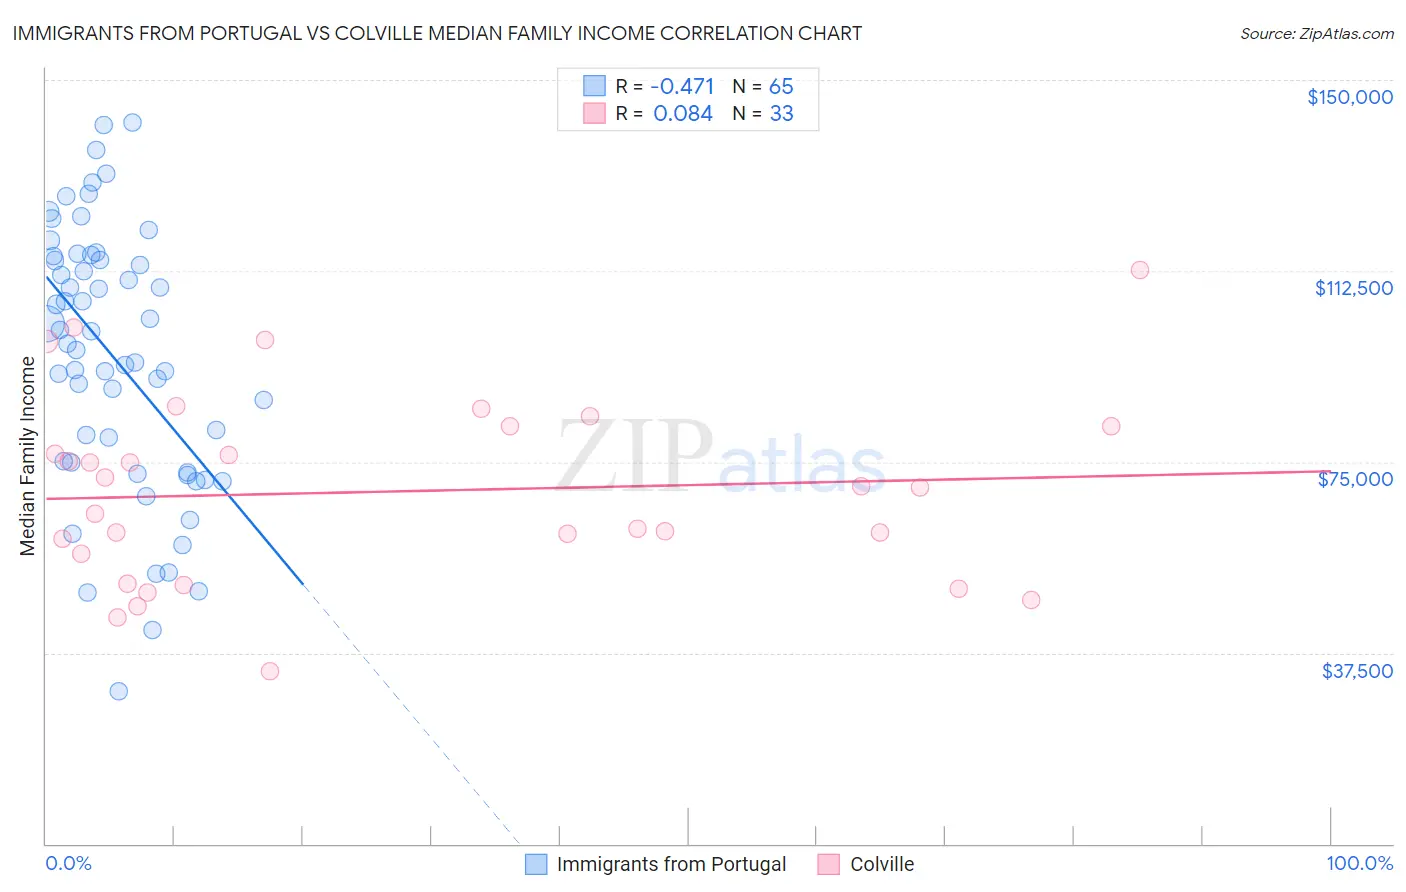
Immigrants from Portugal vs Colville Median Family Income Correlation Chart
The statistical analysis conducted on geographies consisting of 174,753,640 people shows a moderate negative correlation between the proportion of Immigrants from Portugal and median family income in the United States with a correlation coefficient (R) of -0.471 and weighted average of $100,984. Similarly, the statistical analysis conducted on geographies consisting of 34,680,416 people shows a slight positive correlation between the proportion of Colville and median family income in the United States with a correlation coefficient (R) of 0.084 and weighted average of $85,792, a difference of 17.7%.
Median Family Income Correlation Summary
| Measurement | Immigrants from Portugal | Colville |
| Minimum | $29,911 | $33,824 |
| Maximum | $141,703 | $112,639 |
| Range | $111,792 | $78,815 |
| Mean | $95,434 | $69,185 |
| Median | $98,112 | $70,000 |
| Interquartile 25% (IQ1) | $73,840 | $53,997 |
| Interquartile 75% (IQ3) | $114,950 | $82,061 |
| Interquartile Range (IQR) | $41,110 | $28,064 |
| Standard Deviation (Sample) | $25,863 | $18,382 |
| Standard Deviation (Population) | $25,663 | $18,102 |
Similar Demographics by Median Family Income
Demographics Similar to Immigrants from Portugal by Median Family Income
In terms of median family income, the demographic groups most similar to Immigrants from Portugal are Immigrants ($100,962, a difference of 0.020%), Guamanian/Chamorro ($101,061, a difference of 0.080%), Tlingit-Haida ($101,092, a difference of 0.11%), Celtic ($101,139, a difference of 0.15%), and Dutch ($101,192, a difference of 0.21%).
| Demographics | Rating | Rank | Median Family Income |
| Tsimshian | 35.9 /100 | #182 | Fair $101,543 |
| Kenyans | 34.5 /100 | #183 | Fair $101,417 |
| Immigrants | Costa Rica | 33.7 /100 | #184 | Fair $101,354 |
| Dutch | 31.9 /100 | #185 | Fair $101,192 |
| Celtics | 31.3 /100 | #186 | Fair $101,139 |
| Tlingit-Haida | 30.8 /100 | #187 | Fair $101,092 |
| Guamanians/Chamorros | 30.5 /100 | #188 | Fair $101,061 |
| Immigrants | Portugal | 29.6 /100 | #189 | Fair $100,984 |
| Immigrants | Immigrants | 29.4 /100 | #190 | Fair $100,962 |
| Colombians | 27.2 /100 | #191 | Fair $100,750 |
| Immigrants | Kenya | 26.5 /100 | #192 | Fair $100,679 |
| Iraqis | 26.3 /100 | #193 | Fair $100,658 |
| Uruguayans | 26.3 /100 | #194 | Fair $100,656 |
| Immigrants | South America | 23.9 /100 | #195 | Fair $100,414 |
| Samoans | 23.3 /100 | #196 | Fair $100,344 |
Demographics Similar to Colville by Median Family Income
In terms of median family income, the demographic groups most similar to Colville are Spanish American Indian ($85,728, a difference of 0.070%), Hispanic or Latino ($85,647, a difference of 0.17%), Mexican ($85,618, a difference of 0.20%), Paiute ($85,414, a difference of 0.44%), and Immigrants from Dominica ($85,411, a difference of 0.45%).
| Demographics | Rating | Rank | Median Family Income |
| Fijians | 0.0 /100 | #294 | Tragic $87,387 |
| Yaqui | 0.0 /100 | #295 | Tragic $87,289 |
| Immigrants | Guatemala | 0.0 /100 | #296 | Tragic $87,191 |
| Cajuns | 0.0 /100 | #297 | Tragic $87,157 |
| Immigrants | Latin America | 0.0 /100 | #298 | Tragic $86,989 |
| Chippewa | 0.0 /100 | #299 | Tragic $86,852 |
| Ottawa | 0.0 /100 | #300 | Tragic $86,380 |
| Colville | 0.0 /100 | #301 | Tragic $85,792 |
| Spanish American Indians | 0.0 /100 | #302 | Tragic $85,728 |
| Hispanics or Latinos | 0.0 /100 | #303 | Tragic $85,647 |
| Mexicans | 0.0 /100 | #304 | Tragic $85,618 |
| Paiute | 0.0 /100 | #305 | Tragic $85,414 |
| Immigrants | Dominica | 0.0 /100 | #306 | Tragic $85,411 |
| Chickasaw | 0.0 /100 | #307 | Tragic $85,356 |
| U.S. Virgin Islanders | 0.0 /100 | #308 | Tragic $85,294 |