Immigrants from Panama vs Immigrants from Jordan Median Earnings
COMPARE
Immigrants from Panama
Immigrants from Jordan
Median Earnings
Median Earnings Comparison
Immigrants from Panama
Immigrants from Jordan
$45,198
MEDIAN EARNINGS
15.0/ 100
METRIC RATING
222nd/ 347
METRIC RANK
$48,673
MEDIAN EARNINGS
95.9/ 100
METRIC RATING
118th/ 347
METRIC RANK
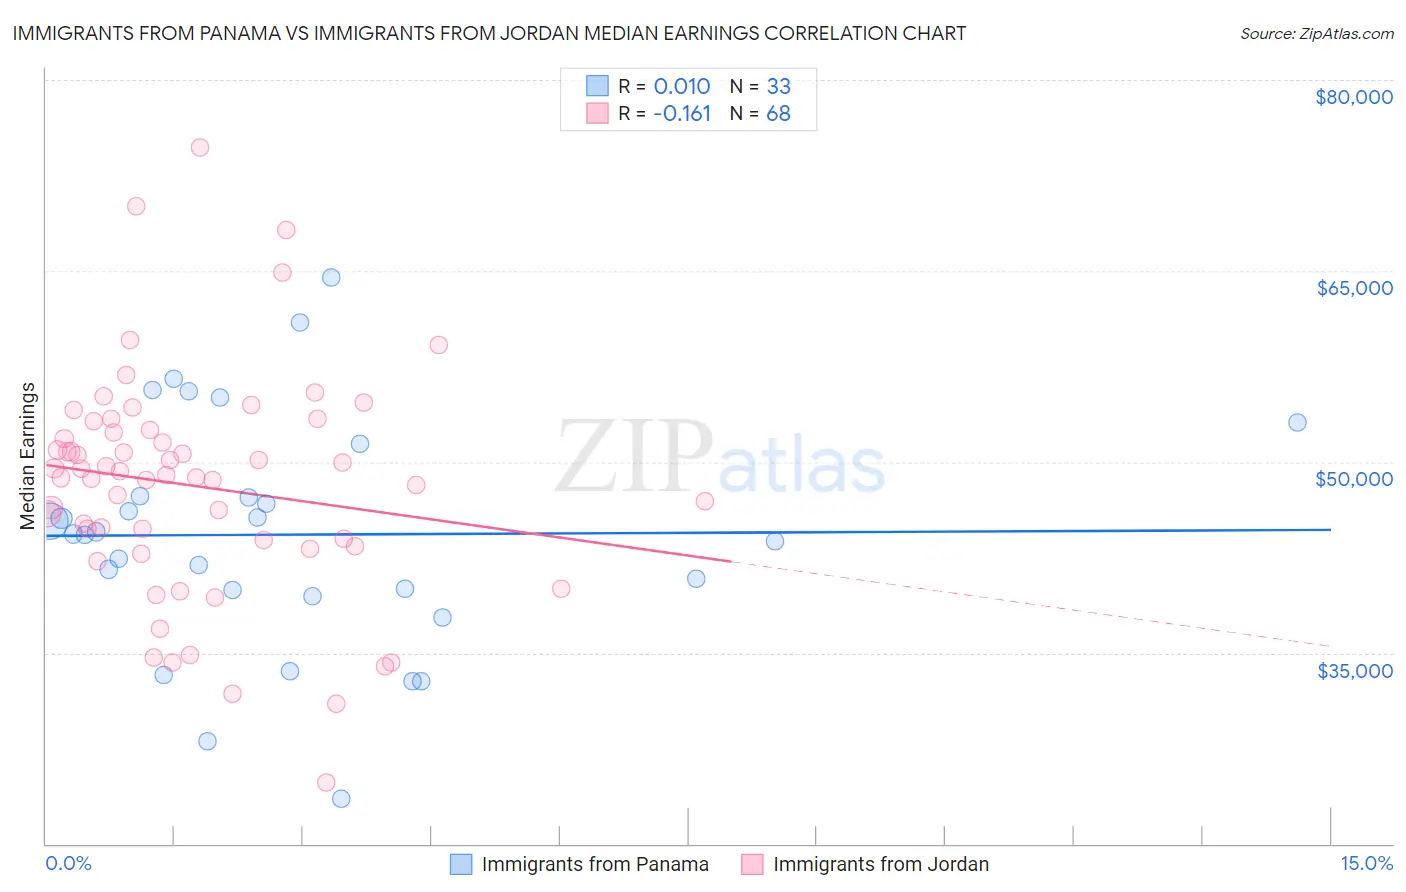
Immigrants from Panama vs Immigrants from Jordan Median Earnings Correlation Chart
The statistical analysis conducted on geographies consisting of 221,169,853 people shows no correlation between the proportion of Immigrants from Panama and median earnings in the United States with a correlation coefficient (R) of 0.010 and weighted average of $45,198. Similarly, the statistical analysis conducted on geographies consisting of 181,245,350 people shows a poor negative correlation between the proportion of Immigrants from Jordan and median earnings in the United States with a correlation coefficient (R) of -0.161 and weighted average of $48,673, a difference of 7.7%.
Median Earnings Correlation Summary
| Measurement | Immigrants from Panama | Immigrants from Jordan |
| Minimum | $23,516 | $24,779 |
| Maximum | $64,519 | $74,707 |
| Range | $41,003 | $49,928 |
| Mean | $44,283 | $48,083 |
| Median | $44,355 | $48,848 |
| Interquartile 25% (IQ1) | $39,682 | $43,626 |
| Interquartile 75% (IQ3) | $49,375 | $52,401 |
| Interquartile Range (IQR) | $9,693 | $8,775 |
| Standard Deviation (Sample) | $9,181 | $8,922 |
| Standard Deviation (Population) | $9,041 | $8,857 |
Similar Demographics by Median Earnings
Demographics Similar to Immigrants from Panama by Median Earnings
In terms of median earnings, the demographic groups most similar to Immigrants from Panama are White/Caucasian ($45,197, a difference of 0.0%), Immigrants from Guyana ($45,204, a difference of 0.010%), Ecuadorian ($45,214, a difference of 0.030%), West Indian ($45,132, a difference of 0.15%), and Immigrants from Cambodia ($45,090, a difference of 0.24%).
| Demographics | Rating | Rank | Median Earnings |
| Immigrants | Bangladesh | 22.0 /100 | #215 | Fair $45,532 |
| Guyanese | 20.6 /100 | #216 | Fair $45,470 |
| Tlingit-Haida | 20.5 /100 | #217 | Fair $45,468 |
| Spanish | 19.7 /100 | #218 | Poor $45,432 |
| Dutch | 18.4 /100 | #219 | Poor $45,370 |
| Ecuadorians | 15.3 /100 | #220 | Poor $45,214 |
| Immigrants | Guyana | 15.1 /100 | #221 | Poor $45,204 |
| Immigrants | Panama | 15.0 /100 | #222 | Poor $45,198 |
| Whites/Caucasians | 15.0 /100 | #223 | Poor $45,197 |
| West Indians | 13.9 /100 | #224 | Poor $45,132 |
| Immigrants | Cambodia | 13.2 /100 | #225 | Poor $45,090 |
| Immigrants | Nigeria | 12.2 /100 | #226 | Poor $45,030 |
| Native Hawaiians | 12.2 /100 | #227 | Poor $45,027 |
| Immigrants | Iraq | 11.6 /100 | #228 | Poor $44,988 |
| Scotch-Irish | 10.7 /100 | #229 | Poor $44,924 |
Demographics Similar to Immigrants from Jordan by Median Earnings
In terms of median earnings, the demographic groups most similar to Immigrants from Jordan are Serbian ($48,677, a difference of 0.010%), Polish ($48,659, a difference of 0.030%), Korean ($48,727, a difference of 0.11%), Carpatho Rusyn ($48,617, a difference of 0.11%), and Arab ($48,599, a difference of 0.15%).
| Demographics | Rating | Rank | Median Earnings |
| Immigrants | Zimbabwe | 97.0 /100 | #111 | Exceptional $48,913 |
| Northern Europeans | 96.9 /100 | #112 | Exceptional $48,887 |
| Immigrants | Kuwait | 96.8 /100 | #113 | Exceptional $48,861 |
| Moroccans | 96.7 /100 | #114 | Exceptional $48,838 |
| Chinese | 96.7 /100 | #115 | Exceptional $48,836 |
| Koreans | 96.2 /100 | #116 | Exceptional $48,727 |
| Serbians | 95.9 /100 | #117 | Exceptional $48,677 |
| Immigrants | Jordan | 95.9 /100 | #118 | Exceptional $48,673 |
| Poles | 95.8 /100 | #119 | Exceptional $48,659 |
| Carpatho Rusyns | 95.5 /100 | #120 | Exceptional $48,617 |
| Arabs | 95.4 /100 | #121 | Exceptional $48,599 |
| Chileans | 94.8 /100 | #122 | Exceptional $48,504 |
| Immigrants | Syria | 93.9 /100 | #123 | Exceptional $48,375 |
| Brazilians | 93.7 /100 | #124 | Exceptional $48,356 |
| Immigrants | Fiji | 93.3 /100 | #125 | Exceptional $48,305 |