Immigrants from Panama vs Immigrants from Middle Africa Median Earnings
COMPARE
Immigrants from Panama
Immigrants from Middle Africa
Median Earnings
Median Earnings Comparison
Immigrants from Panama
Immigrants from Middle Africa
$45,198
MEDIAN EARNINGS
15.0/ 100
METRIC RATING
222nd/ 347
METRIC RANK
$43,416
MEDIAN EARNINGS
1.4/ 100
METRIC RATING
255th/ 347
METRIC RANK
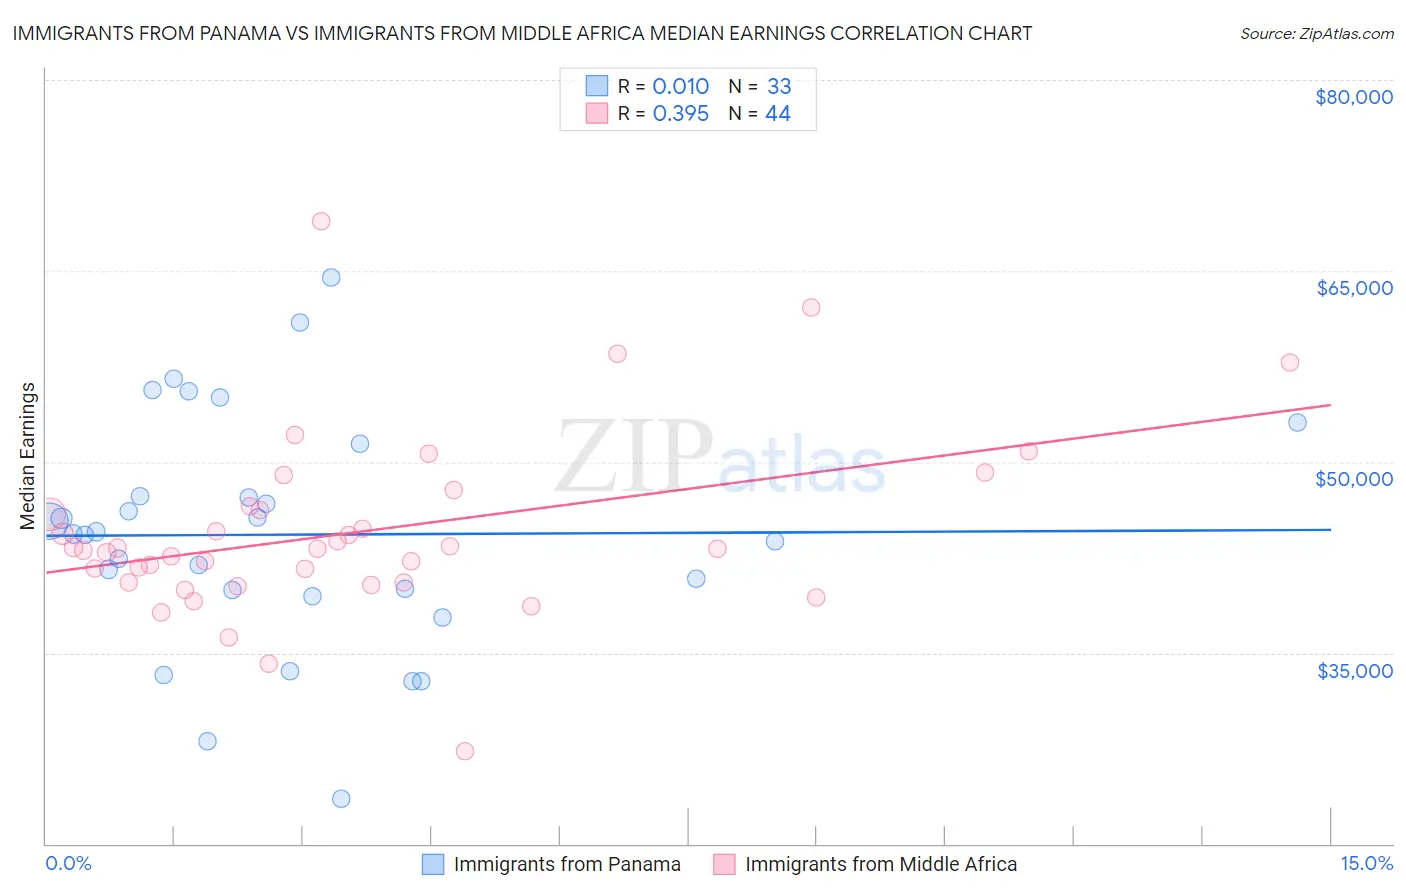
Immigrants from Panama vs Immigrants from Middle Africa Median Earnings Correlation Chart
The statistical analysis conducted on geographies consisting of 221,169,853 people shows no correlation between the proportion of Immigrants from Panama and median earnings in the United States with a correlation coefficient (R) of 0.010 and weighted average of $45,198. Similarly, the statistical analysis conducted on geographies consisting of 202,728,521 people shows a mild positive correlation between the proportion of Immigrants from Middle Africa and median earnings in the United States with a correlation coefficient (R) of 0.395 and weighted average of $43,416, a difference of 4.1%.
Median Earnings Correlation Summary
| Measurement | Immigrants from Panama | Immigrants from Middle Africa |
| Minimum | $23,516 | $27,307 |
| Maximum | $64,519 | $68,894 |
| Range | $41,003 | $41,587 |
| Mean | $44,283 | $44,490 |
| Median | $44,355 | $43,158 |
| Interquartile 25% (IQ1) | $39,682 | $40,556 |
| Interquartile 75% (IQ3) | $49,375 | $46,358 |
| Interquartile Range (IQR) | $9,693 | $5,802 |
| Standard Deviation (Sample) | $9,181 | $7,197 |
| Standard Deviation (Population) | $9,041 | $7,115 |
Similar Demographics by Median Earnings
Demographics Similar to Immigrants from Panama by Median Earnings
In terms of median earnings, the demographic groups most similar to Immigrants from Panama are White/Caucasian ($45,197, a difference of 0.0%), Immigrants from Guyana ($45,204, a difference of 0.010%), Ecuadorian ($45,214, a difference of 0.030%), West Indian ($45,132, a difference of 0.15%), and Immigrants from Cambodia ($45,090, a difference of 0.24%).
| Demographics | Rating | Rank | Median Earnings |
| Immigrants | Bangladesh | 22.0 /100 | #215 | Fair $45,532 |
| Guyanese | 20.6 /100 | #216 | Fair $45,470 |
| Tlingit-Haida | 20.5 /100 | #217 | Fair $45,468 |
| Spanish | 19.7 /100 | #218 | Poor $45,432 |
| Dutch | 18.4 /100 | #219 | Poor $45,370 |
| Ecuadorians | 15.3 /100 | #220 | Poor $45,214 |
| Immigrants | Guyana | 15.1 /100 | #221 | Poor $45,204 |
| Immigrants | Panama | 15.0 /100 | #222 | Poor $45,198 |
| Whites/Caucasians | 15.0 /100 | #223 | Poor $45,197 |
| West Indians | 13.9 /100 | #224 | Poor $45,132 |
| Immigrants | Cambodia | 13.2 /100 | #225 | Poor $45,090 |
| Immigrants | Nigeria | 12.2 /100 | #226 | Poor $45,030 |
| Native Hawaiians | 12.2 /100 | #227 | Poor $45,027 |
| Immigrants | Iraq | 11.6 /100 | #228 | Poor $44,988 |
| Scotch-Irish | 10.7 /100 | #229 | Poor $44,924 |
Demographics Similar to Immigrants from Middle Africa by Median Earnings
In terms of median earnings, the demographic groups most similar to Immigrants from Middle Africa are Alaskan Athabascan ($43,393, a difference of 0.050%), Jamaican ($43,343, a difference of 0.17%), French American Indian ($43,333, a difference of 0.19%), Liberian ($43,536, a difference of 0.28%), and Somali ($43,567, a difference of 0.35%).
| Demographics | Rating | Rank | Median Earnings |
| Nepalese | 2.6 /100 | #248 | Tragic $43,860 |
| Malaysians | 2.6 /100 | #249 | Tragic $43,844 |
| Alaska Natives | 2.3 /100 | #250 | Tragic $43,750 |
| Tsimshian | 2.1 /100 | #251 | Tragic $43,695 |
| Hawaiians | 2.0 /100 | #252 | Tragic $43,673 |
| Somalis | 1.8 /100 | #253 | Tragic $43,567 |
| Liberians | 1.7 /100 | #254 | Tragic $43,536 |
| Immigrants | Middle Africa | 1.4 /100 | #255 | Tragic $43,416 |
| Alaskan Athabascans | 1.4 /100 | #256 | Tragic $43,393 |
| Jamaicans | 1.3 /100 | #257 | Tragic $43,343 |
| French American Indians | 1.3 /100 | #258 | Tragic $43,333 |
| German Russians | 1.1 /100 | #259 | Tragic $43,200 |
| Immigrants | Somalia | 0.9 /100 | #260 | Tragic $43,100 |
| Immigrants | Jamaica | 0.8 /100 | #261 | Tragic $43,026 |
| Nicaraguans | 0.8 /100 | #262 | Tragic $43,026 |