Immigrants from Northern Africa vs Soviet Union Median Earnings
COMPARE
Immigrants from Northern Africa
Soviet Union
Median Earnings
Median Earnings Comparison
Immigrants from Northern Africa
Soviet Union
$49,648
MEDIAN EARNINGS
98.9/ 100
METRIC RATING
98th/ 347
METRIC RANK
$54,290
MEDIAN EARNINGS
100.0/ 100
METRIC RATING
24th/ 347
METRIC RANK
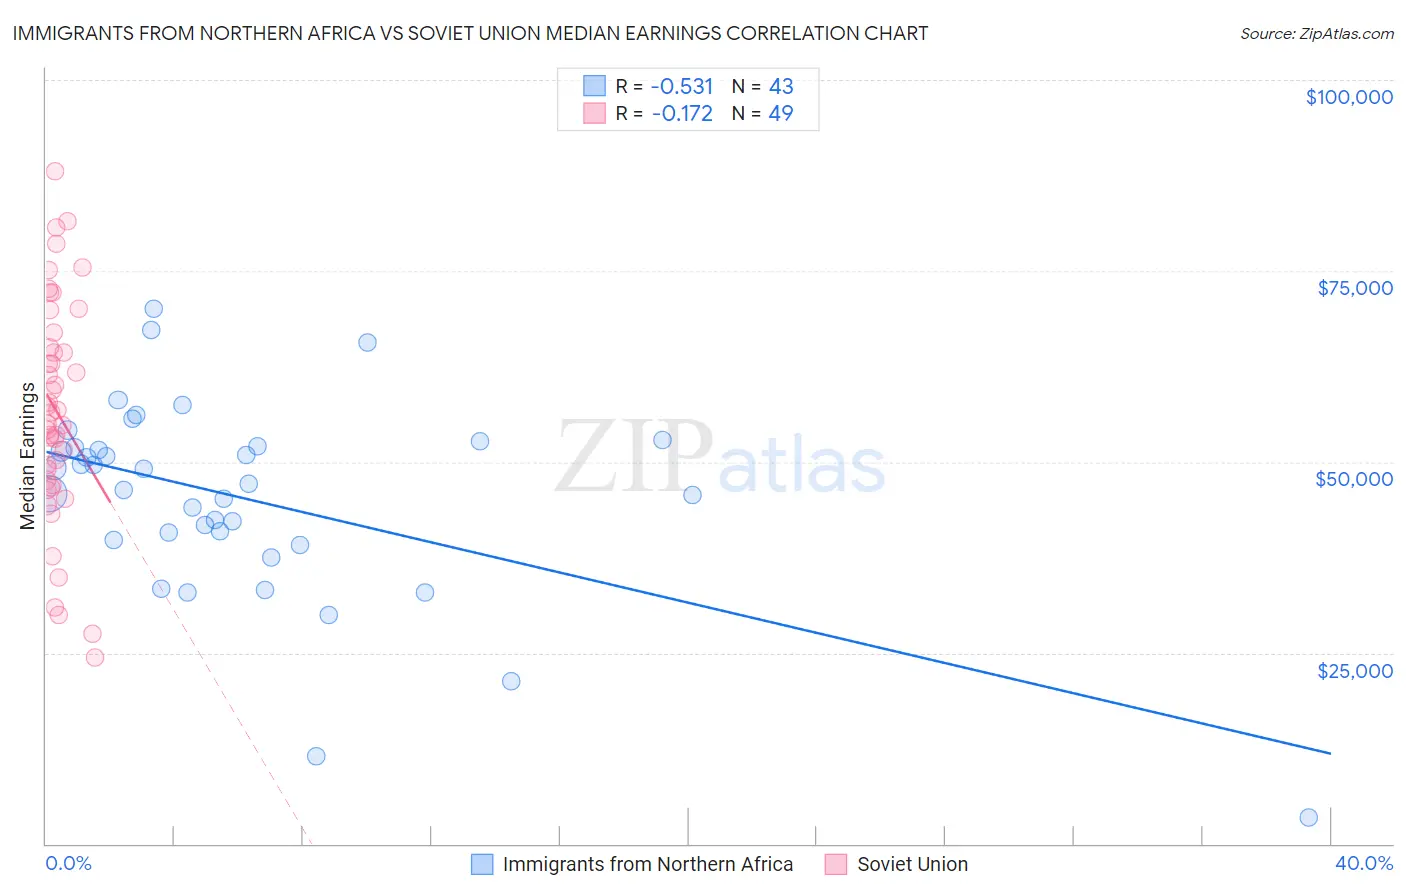
Immigrants from Northern Africa vs Soviet Union Median Earnings Correlation Chart
The statistical analysis conducted on geographies consisting of 321,196,666 people shows a substantial negative correlation between the proportion of Immigrants from Northern Africa and median earnings in the United States with a correlation coefficient (R) of -0.531 and weighted average of $49,648. Similarly, the statistical analysis conducted on geographies consisting of 43,511,973 people shows a poor negative correlation between the proportion of Soviet Union and median earnings in the United States with a correlation coefficient (R) of -0.172 and weighted average of $54,290, a difference of 9.3%.
Median Earnings Correlation Summary
| Measurement | Immigrants from Northern Africa | Soviet Union |
| Minimum | $3,500 | $24,432 |
| Maximum | $70,043 | $88,077 |
| Range | $66,543 | $63,645 |
| Mean | $45,203 | $56,673 |
| Median | $47,214 | $56,451 |
| Interquartile 25% (IQ1) | $39,837 | $47,287 |
| Interquartile 75% (IQ3) | $52,025 | $65,993 |
| Interquartile Range (IQR) | $12,188 | $18,706 |
| Standard Deviation (Sample) | $12,971 | $14,478 |
| Standard Deviation (Population) | $12,819 | $14,329 |
Similar Demographics by Median Earnings
Demographics Similar to Immigrants from Northern Africa by Median Earnings
In terms of median earnings, the demographic groups most similar to Immigrants from Northern Africa are Immigrants from Afghanistan ($49,645, a difference of 0.010%), Immigrants from North Macedonia ($49,658, a difference of 0.020%), Immigrants from Poland ($49,633, a difference of 0.030%), Jordanian ($49,632, a difference of 0.030%), and Immigrants from Lebanon ($49,682, a difference of 0.070%).
| Demographics | Rating | Rank | Median Earnings |
| Macedonians | 99.2 /100 | #91 | Exceptional $49,893 |
| Immigrants | Argentina | 99.2 /100 | #92 | Exceptional $49,841 |
| Armenians | 99.1 /100 | #93 | Exceptional $49,804 |
| Croatians | 99.0 /100 | #94 | Exceptional $49,724 |
| Immigrants | England | 99.0 /100 | #95 | Exceptional $49,722 |
| Immigrants | Lebanon | 99.0 /100 | #96 | Exceptional $49,682 |
| Immigrants | North Macedonia | 98.9 /100 | #97 | Exceptional $49,658 |
| Immigrants | Northern Africa | 98.9 /100 | #98 | Exceptional $49,648 |
| Immigrants | Afghanistan | 98.9 /100 | #99 | Exceptional $49,645 |
| Immigrants | Poland | 98.9 /100 | #100 | Exceptional $49,633 |
| Jordanians | 98.9 /100 | #101 | Exceptional $49,632 |
| Ethiopians | 98.8 /100 | #102 | Exceptional $49,572 |
| Austrians | 98.7 /100 | #103 | Exceptional $49,501 |
| Immigrants | Brazil | 98.6 /100 | #104 | Exceptional $49,463 |
| Immigrants | Western Asia | 98.4 /100 | #105 | Exceptional $49,389 |
Demographics Similar to Soviet Union by Median Earnings
In terms of median earnings, the demographic groups most similar to Soviet Union are Immigrants from Sweden ($54,478, a difference of 0.35%), Immigrants from Korea ($54,530, a difference of 0.44%), Burmese ($54,559, a difference of 0.50%), Cypriot ($54,589, a difference of 0.55%), and Turkish ($53,919, a difference of 0.69%).
| Demographics | Rating | Rank | Median Earnings |
| Eastern Europeans | 100.0 /100 | #17 | Exceptional $55,084 |
| Immigrants | Japan | 100.0 /100 | #18 | Exceptional $54,938 |
| Immigrants | Belgium | 100.0 /100 | #19 | Exceptional $54,679 |
| Cypriots | 100.0 /100 | #20 | Exceptional $54,589 |
| Burmese | 100.0 /100 | #21 | Exceptional $54,559 |
| Immigrants | Korea | 100.0 /100 | #22 | Exceptional $54,530 |
| Immigrants | Sweden | 100.0 /100 | #23 | Exceptional $54,478 |
| Soviet Union | 100.0 /100 | #24 | Exceptional $54,290 |
| Turks | 100.0 /100 | #25 | Exceptional $53,919 |
| Immigrants | Northern Europe | 100.0 /100 | #26 | Exceptional $53,872 |
| Asians | 100.0 /100 | #27 | Exceptional $53,690 |
| Immigrants | France | 100.0 /100 | #28 | Exceptional $53,490 |
| Immigrants | Russia | 100.0 /100 | #29 | Exceptional $53,457 |
| Cambodians | 100.0 /100 | #30 | Exceptional $53,386 |
| Russians | 100.0 /100 | #31 | Exceptional $53,334 |