Immigrants from Northern Africa vs Immigrants from Jordan Median Earnings
COMPARE
Immigrants from Northern Africa
Immigrants from Jordan
Median Earnings
Median Earnings Comparison
Immigrants from Northern Africa
Immigrants from Jordan
$49,648
MEDIAN EARNINGS
98.9/ 100
METRIC RATING
98th/ 347
METRIC RANK
$48,673
MEDIAN EARNINGS
95.9/ 100
METRIC RATING
118th/ 347
METRIC RANK
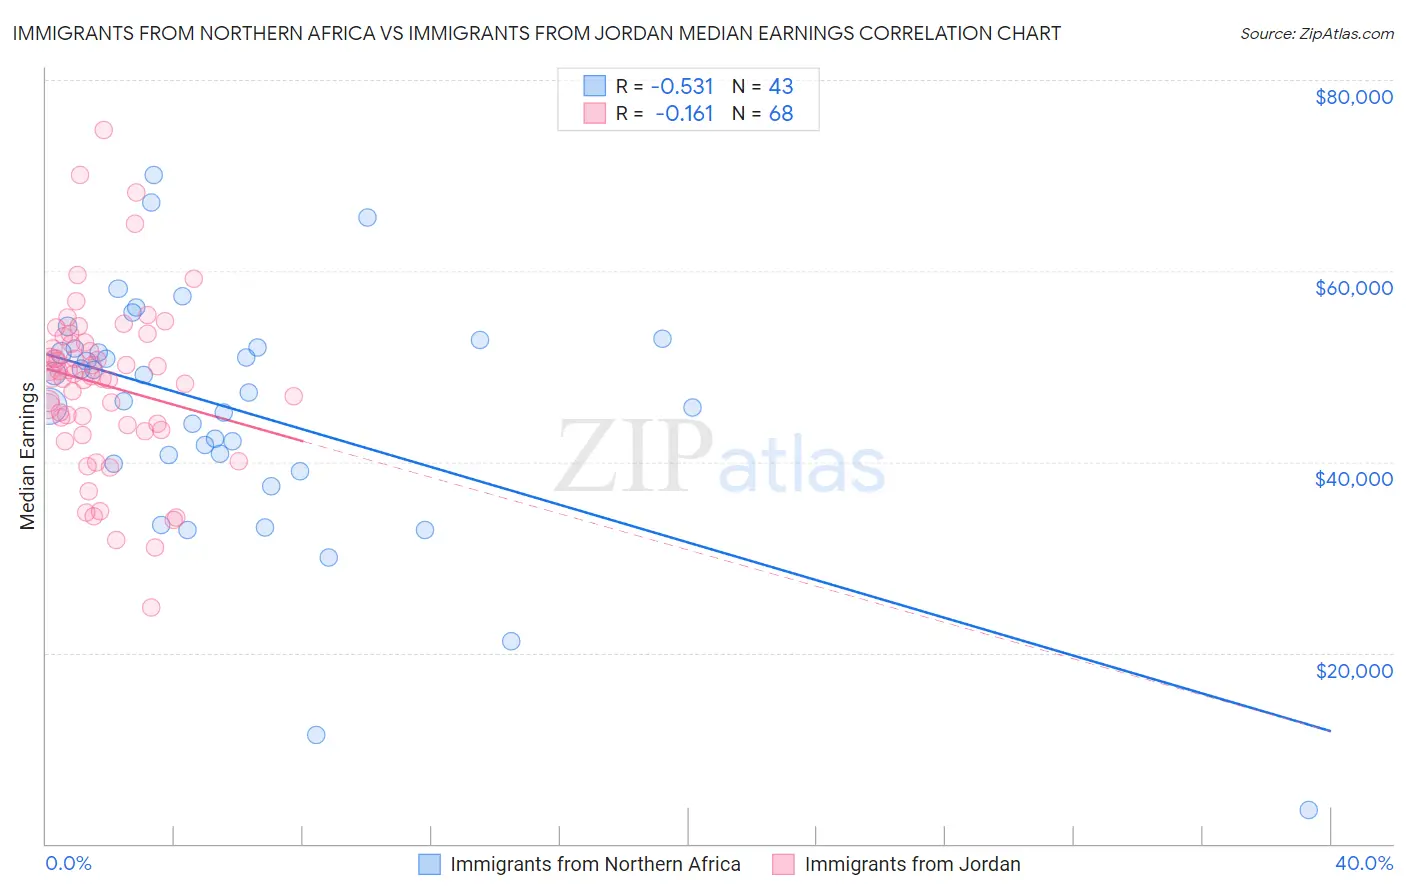
Immigrants from Northern Africa vs Immigrants from Jordan Median Earnings Correlation Chart
The statistical analysis conducted on geographies consisting of 321,196,666 people shows a substantial negative correlation between the proportion of Immigrants from Northern Africa and median earnings in the United States with a correlation coefficient (R) of -0.531 and weighted average of $49,648. Similarly, the statistical analysis conducted on geographies consisting of 181,245,350 people shows a poor negative correlation between the proportion of Immigrants from Jordan and median earnings in the United States with a correlation coefficient (R) of -0.161 and weighted average of $48,673, a difference of 2.0%.
Median Earnings Correlation Summary
| Measurement | Immigrants from Northern Africa | Immigrants from Jordan |
| Minimum | $3,500 | $24,779 |
| Maximum | $70,043 | $74,707 |
| Range | $66,543 | $49,928 |
| Mean | $45,203 | $48,083 |
| Median | $47,214 | $48,848 |
| Interquartile 25% (IQ1) | $39,837 | $43,626 |
| Interquartile 75% (IQ3) | $52,025 | $52,401 |
| Interquartile Range (IQR) | $12,188 | $8,775 |
| Standard Deviation (Sample) | $12,971 | $8,922 |
| Standard Deviation (Population) | $12,819 | $8,857 |
Demographics Similar to Immigrants from Northern Africa and Immigrants from Jordan by Median Earnings
In terms of median earnings, the demographic groups most similar to Immigrants from Northern Africa are Immigrants from Afghanistan ($49,645, a difference of 0.010%), Immigrants from Poland ($49,633, a difference of 0.030%), Jordanian ($49,632, a difference of 0.030%), Ethiopian ($49,572, a difference of 0.15%), and Austrian ($49,501, a difference of 0.30%). Similarly, the demographic groups most similar to Immigrants from Jordan are Serbian ($48,677, a difference of 0.010%), Korean ($48,727, a difference of 0.11%), Moroccan ($48,838, a difference of 0.34%), Chinese ($48,836, a difference of 0.34%), and Immigrants from Kuwait ($48,861, a difference of 0.39%).
| Demographics | Rating | Rank | Median Earnings |
| Immigrants | Northern Africa | 98.9 /100 | #98 | Exceptional $49,648 |
| Immigrants | Afghanistan | 98.9 /100 | #99 | Exceptional $49,645 |
| Immigrants | Poland | 98.9 /100 | #100 | Exceptional $49,633 |
| Jordanians | 98.9 /100 | #101 | Exceptional $49,632 |
| Ethiopians | 98.8 /100 | #102 | Exceptional $49,572 |
| Austrians | 98.7 /100 | #103 | Exceptional $49,501 |
| Immigrants | Brazil | 98.6 /100 | #104 | Exceptional $49,463 |
| Immigrants | Western Asia | 98.4 /100 | #105 | Exceptional $49,389 |
| Immigrants | Albania | 98.4 /100 | #106 | Exceptional $49,377 |
| Immigrants | Morocco | 98.4 /100 | #107 | Exceptional $49,368 |
| Palestinians | 98.0 /100 | #108 | Exceptional $49,209 |
| Syrians | 97.1 /100 | #109 | Exceptional $48,934 |
| Immigrants | Ethiopia | 97.1 /100 | #110 | Exceptional $48,924 |
| Immigrants | Zimbabwe | 97.0 /100 | #111 | Exceptional $48,913 |
| Northern Europeans | 96.9 /100 | #112 | Exceptional $48,887 |
| Immigrants | Kuwait | 96.8 /100 | #113 | Exceptional $48,861 |
| Moroccans | 96.7 /100 | #114 | Exceptional $48,838 |
| Chinese | 96.7 /100 | #115 | Exceptional $48,836 |
| Koreans | 96.2 /100 | #116 | Exceptional $48,727 |
| Serbians | 95.9 /100 | #117 | Exceptional $48,677 |
| Immigrants | Jordan | 95.9 /100 | #118 | Exceptional $48,673 |