Spanish American Indian vs Soviet Union Median Earnings
COMPARE
Spanish American Indian
Soviet Union
Median Earnings
Median Earnings Comparison
Spanish American Indians
Soviet Union
$38,907
MEDIAN EARNINGS
0.0/ 100
METRIC RATING
334th/ 347
METRIC RANK
$54,290
MEDIAN EARNINGS
100.0/ 100
METRIC RATING
24th/ 347
METRIC RANK
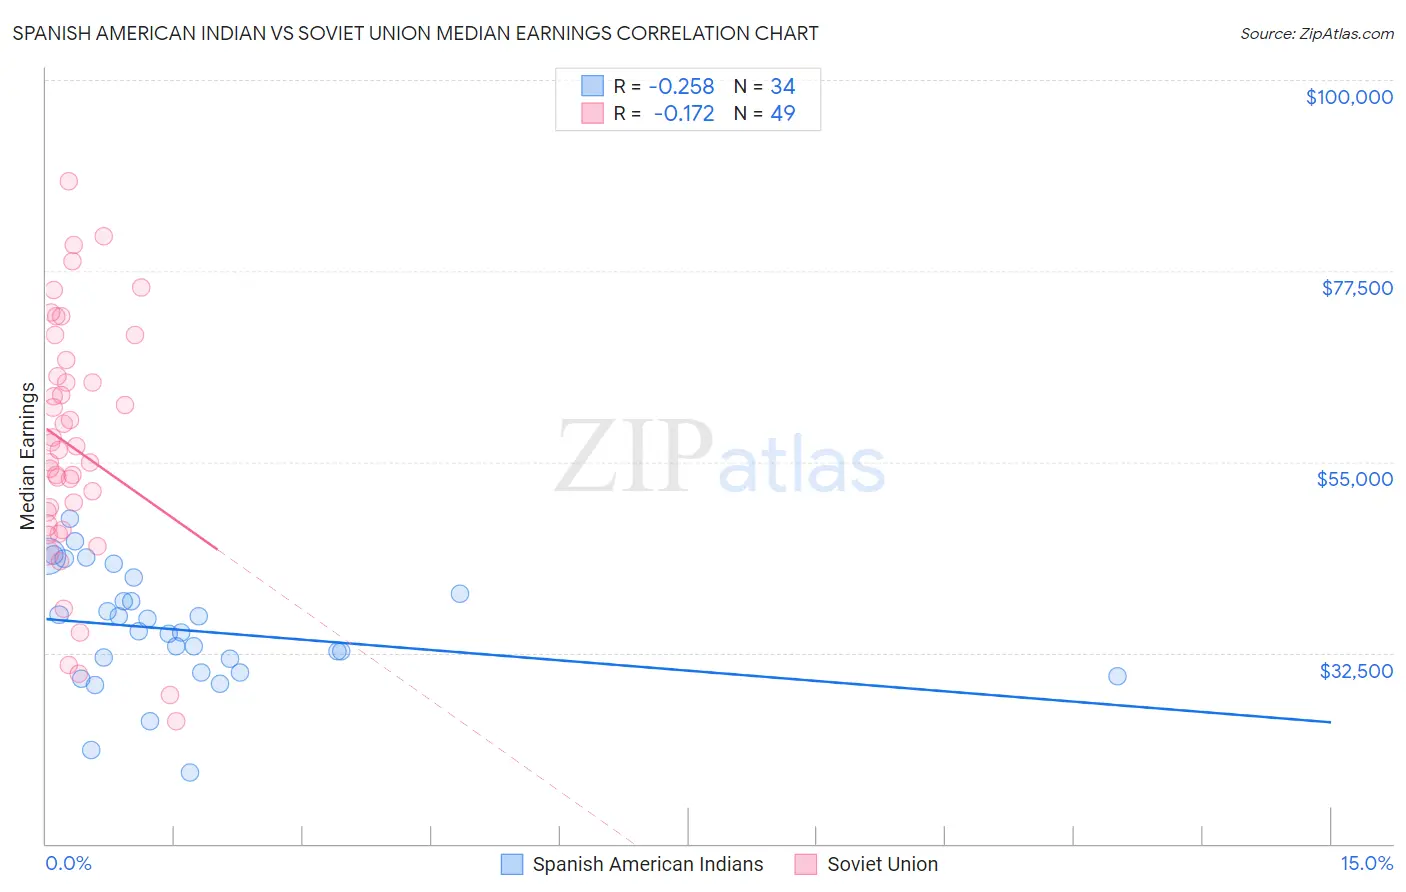
Spanish American Indian vs Soviet Union Median Earnings Correlation Chart
The statistical analysis conducted on geographies consisting of 73,148,786 people shows a weak negative correlation between the proportion of Spanish American Indians and median earnings in the United States with a correlation coefficient (R) of -0.258 and weighted average of $38,907. Similarly, the statistical analysis conducted on geographies consisting of 43,511,973 people shows a poor negative correlation between the proportion of Soviet Union and median earnings in the United States with a correlation coefficient (R) of -0.172 and weighted average of $54,290, a difference of 39.5%.
Median Earnings Correlation Summary
| Measurement | Spanish American Indian | Soviet Union |
| Minimum | $18,469 | $24,432 |
| Maximum | $48,281 | $88,077 |
| Range | $29,812 | $63,645 |
| Mean | $35,173 | $56,673 |
| Median | $34,974 | $56,451 |
| Interquartile 25% (IQ1) | $30,208 | $47,287 |
| Interquartile 75% (IQ3) | $39,452 | $65,993 |
| Interquartile Range (IQR) | $9,244 | $18,706 |
| Standard Deviation (Sample) | $6,885 | $14,478 |
| Standard Deviation (Population) | $6,783 | $14,329 |
Similar Demographics by Median Earnings
Demographics Similar to Spanish American Indians by Median Earnings
In terms of median earnings, the demographic groups most similar to Spanish American Indians are Native/Alaskan ($38,896, a difference of 0.030%), Houma ($38,949, a difference of 0.11%), Yakama ($39,107, a difference of 0.52%), Crow ($38,707, a difference of 0.52%), and Immigrants from Mexico ($39,114, a difference of 0.53%).
| Demographics | Rating | Rank | Median Earnings |
| Yuman | 0.0 /100 | #327 | Tragic $39,523 |
| Sioux | 0.0 /100 | #328 | Tragic $39,448 |
| Kiowa | 0.0 /100 | #329 | Tragic $39,232 |
| Immigrants | Congo | 0.0 /100 | #330 | Tragic $39,169 |
| Immigrants | Mexico | 0.0 /100 | #331 | Tragic $39,114 |
| Yakama | 0.0 /100 | #332 | Tragic $39,107 |
| Houma | 0.0 /100 | #333 | Tragic $38,949 |
| Spanish American Indians | 0.0 /100 | #334 | Tragic $38,907 |
| Natives/Alaskans | 0.0 /100 | #335 | Tragic $38,896 |
| Crow | 0.0 /100 | #336 | Tragic $38,707 |
| Immigrants | Cuba | 0.0 /100 | #337 | Tragic $38,426 |
| Pima | 0.0 /100 | #338 | Tragic $38,285 |
| Menominee | 0.0 /100 | #339 | Tragic $37,884 |
| Navajo | 0.0 /100 | #340 | Tragic $36,999 |
| Lumbee | 0.0 /100 | #341 | Tragic $36,876 |
Demographics Similar to Soviet Union by Median Earnings
In terms of median earnings, the demographic groups most similar to Soviet Union are Immigrants from Sweden ($54,478, a difference of 0.35%), Immigrants from Korea ($54,530, a difference of 0.44%), Burmese ($54,559, a difference of 0.50%), Cypriot ($54,589, a difference of 0.55%), and Turkish ($53,919, a difference of 0.69%).
| Demographics | Rating | Rank | Median Earnings |
| Eastern Europeans | 100.0 /100 | #17 | Exceptional $55,084 |
| Immigrants | Japan | 100.0 /100 | #18 | Exceptional $54,938 |
| Immigrants | Belgium | 100.0 /100 | #19 | Exceptional $54,679 |
| Cypriots | 100.0 /100 | #20 | Exceptional $54,589 |
| Burmese | 100.0 /100 | #21 | Exceptional $54,559 |
| Immigrants | Korea | 100.0 /100 | #22 | Exceptional $54,530 |
| Immigrants | Sweden | 100.0 /100 | #23 | Exceptional $54,478 |
| Soviet Union | 100.0 /100 | #24 | Exceptional $54,290 |
| Turks | 100.0 /100 | #25 | Exceptional $53,919 |
| Immigrants | Northern Europe | 100.0 /100 | #26 | Exceptional $53,872 |
| Asians | 100.0 /100 | #27 | Exceptional $53,690 |
| Immigrants | France | 100.0 /100 | #28 | Exceptional $53,490 |
| Immigrants | Russia | 100.0 /100 | #29 | Exceptional $53,457 |
| Cambodians | 100.0 /100 | #30 | Exceptional $53,386 |
| Russians | 100.0 /100 | #31 | Exceptional $53,334 |