Immigrants from Northern Africa vs Soviet Union In Labor Force | Age 30-34
COMPARE
Immigrants from Northern Africa
Soviet Union
In Labor Force | Age 30-34
In Labor Force | Age 30-34 Comparison
Immigrants from Northern Africa
Soviet Union
85.2%
IN LABOR FORCE | AGE 30-34
96.3/ 100
METRIC RATING
107th/ 347
METRIC RANK
85.5%
IN LABOR FORCE | AGE 30-34
99.4/ 100
METRIC RATING
62nd/ 347
METRIC RANK
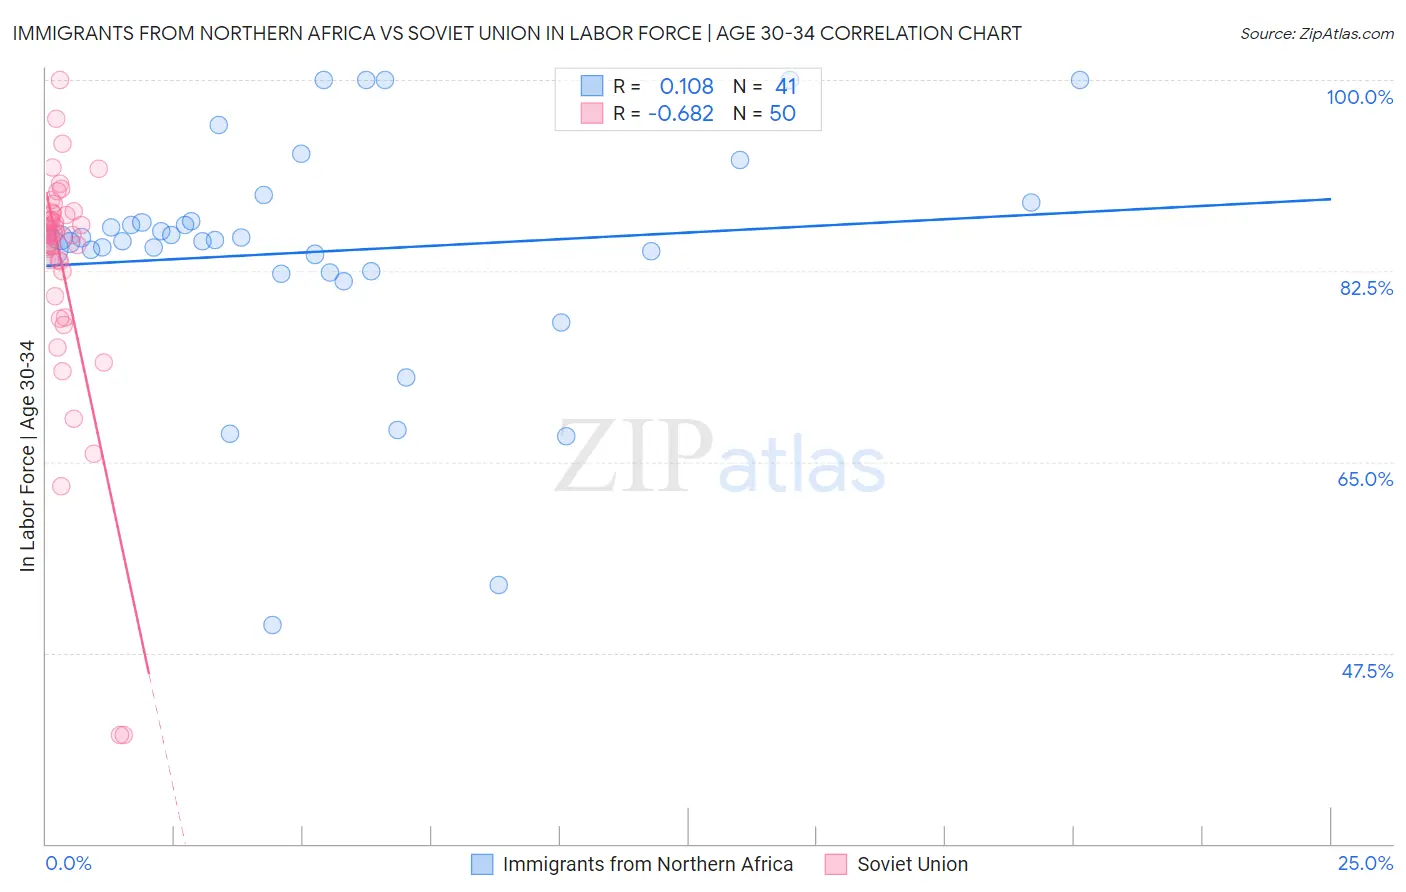
Immigrants from Northern Africa vs Soviet Union In Labor Force | Age 30-34 Correlation Chart
The statistical analysis conducted on geographies consisting of 321,096,130 people shows a poor positive correlation between the proportion of Immigrants from Northern Africa and labor force participation rate among population between the ages 30 and 34 in the United States with a correlation coefficient (R) of 0.108 and weighted average of 85.2%. Similarly, the statistical analysis conducted on geographies consisting of 43,512,203 people shows a significant negative correlation between the proportion of Soviet Union and labor force participation rate among population between the ages 30 and 34 in the United States with a correlation coefficient (R) of -0.682 and weighted average of 85.5%, a difference of 0.34%.
In Labor Force | Age 30-34 Correlation Summary
| Measurement | Immigrants from Northern Africa | Soviet Union |
| Minimum | 50.1% | 40.0% |
| Maximum | 100.0% | 100.0% |
| Range | 49.9% | 60.0% |
| Mean | 84.3% | 82.8% |
| Median | 85.3% | 85.9% |
| Interquartile 25% (IQ1) | 82.4% | 82.5% |
| Interquartile 75% (IQ3) | 88.0% | 87.8% |
| Interquartile Range (IQR) | 5.5% | 5.3% |
| Standard Deviation (Sample) | 10.9% | 11.2% |
| Standard Deviation (Population) | 10.8% | 11.1% |
Similar Demographics by In Labor Force | Age 30-34
Demographics Similar to Immigrants from Northern Africa by In Labor Force | Age 30-34
In terms of in labor force | age 30-34, the demographic groups most similar to Immigrants from Northern Africa are Alsatian (85.2%, a difference of 0.0%), Immigrants from Middle Africa (85.2%, a difference of 0.0%), Ukrainian (85.2%, a difference of 0.010%), Immigrants from Ghana (85.2%, a difference of 0.010%), and Immigrants from Zimbabwe (85.1%, a difference of 0.020%).
| Demographics | Rating | Rank | In Labor Force | Age 30-34 |
| Sudanese | 97.1 /100 | #100 | Exceptional 85.2% |
| Immigrants | Belarus | 96.9 /100 | #101 | Exceptional 85.2% |
| Immigrants | Austria | 96.8 /100 | #102 | Exceptional 85.2% |
| Ukrainians | 96.6 /100 | #103 | Exceptional 85.2% |
| Immigrants | Ghana | 96.5 /100 | #104 | Exceptional 85.2% |
| Alsatians | 96.3 /100 | #105 | Exceptional 85.2% |
| Immigrants | Middle Africa | 96.3 /100 | #106 | Exceptional 85.2% |
| Immigrants | Northern Africa | 96.3 /100 | #107 | Exceptional 85.2% |
| Immigrants | Zimbabwe | 95.8 /100 | #108 | Exceptional 85.1% |
| Argentineans | 95.8 /100 | #109 | Exceptional 85.1% |
| Immigrants | South Africa | 95.3 /100 | #110 | Exceptional 85.1% |
| Immigrants | Scotland | 94.9 /100 | #111 | Exceptional 85.1% |
| Immigrants | Hungary | 94.8 /100 | #112 | Exceptional 85.1% |
| Immigrants | Romania | 94.7 /100 | #113 | Exceptional 85.1% |
| Yugoslavians | 94.7 /100 | #114 | Exceptional 85.1% |
Demographics Similar to Soviet Union by In Labor Force | Age 30-34
In terms of in labor force | age 30-34, the demographic groups most similar to Soviet Union are Macedonian (85.5%, a difference of 0.0%), Immigrants from France (85.5%, a difference of 0.010%), Immigrants from Brazil (85.5%, a difference of 0.010%), Italian (85.4%, a difference of 0.010%), and Senegalese (85.4%, a difference of 0.020%).
| Demographics | Rating | Rank | In Labor Force | Age 30-34 |
| Immigrants | Turkey | 99.6 /100 | #55 | Exceptional 85.5% |
| Czechs | 99.6 /100 | #56 | Exceptional 85.5% |
| Russians | 99.6 /100 | #57 | Exceptional 85.5% |
| Poles | 99.6 /100 | #58 | Exceptional 85.5% |
| Immigrants | Poland | 99.5 /100 | #59 | Exceptional 85.5% |
| Immigrants | France | 99.5 /100 | #60 | Exceptional 85.5% |
| Immigrants | Brazil | 99.5 /100 | #61 | Exceptional 85.5% |
| Soviet Union | 99.4 /100 | #62 | Exceptional 85.5% |
| Macedonians | 99.4 /100 | #63 | Exceptional 85.5% |
| Italians | 99.4 /100 | #64 | Exceptional 85.4% |
| Senegalese | 99.4 /100 | #65 | Exceptional 85.4% |
| Ghanaians | 99.4 /100 | #66 | Exceptional 85.4% |
| Kenyans | 99.3 /100 | #67 | Exceptional 85.4% |
| Immigrants | Eastern Europe | 99.3 /100 | #68 | Exceptional 85.4% |
| Immigrants | Iran | 99.2 /100 | #69 | Exceptional 85.4% |