Immigrants from Northern Africa vs Native/Alaskan Median Earnings
COMPARE
Immigrants from Northern Africa
Native/Alaskan
Median Earnings
Median Earnings Comparison
Immigrants from Northern Africa
Natives/Alaskans
$49,648
MEDIAN EARNINGS
98.9/ 100
METRIC RATING
98th/ 347
METRIC RANK
$38,896
MEDIAN EARNINGS
0.0/ 100
METRIC RATING
335th/ 347
METRIC RANK
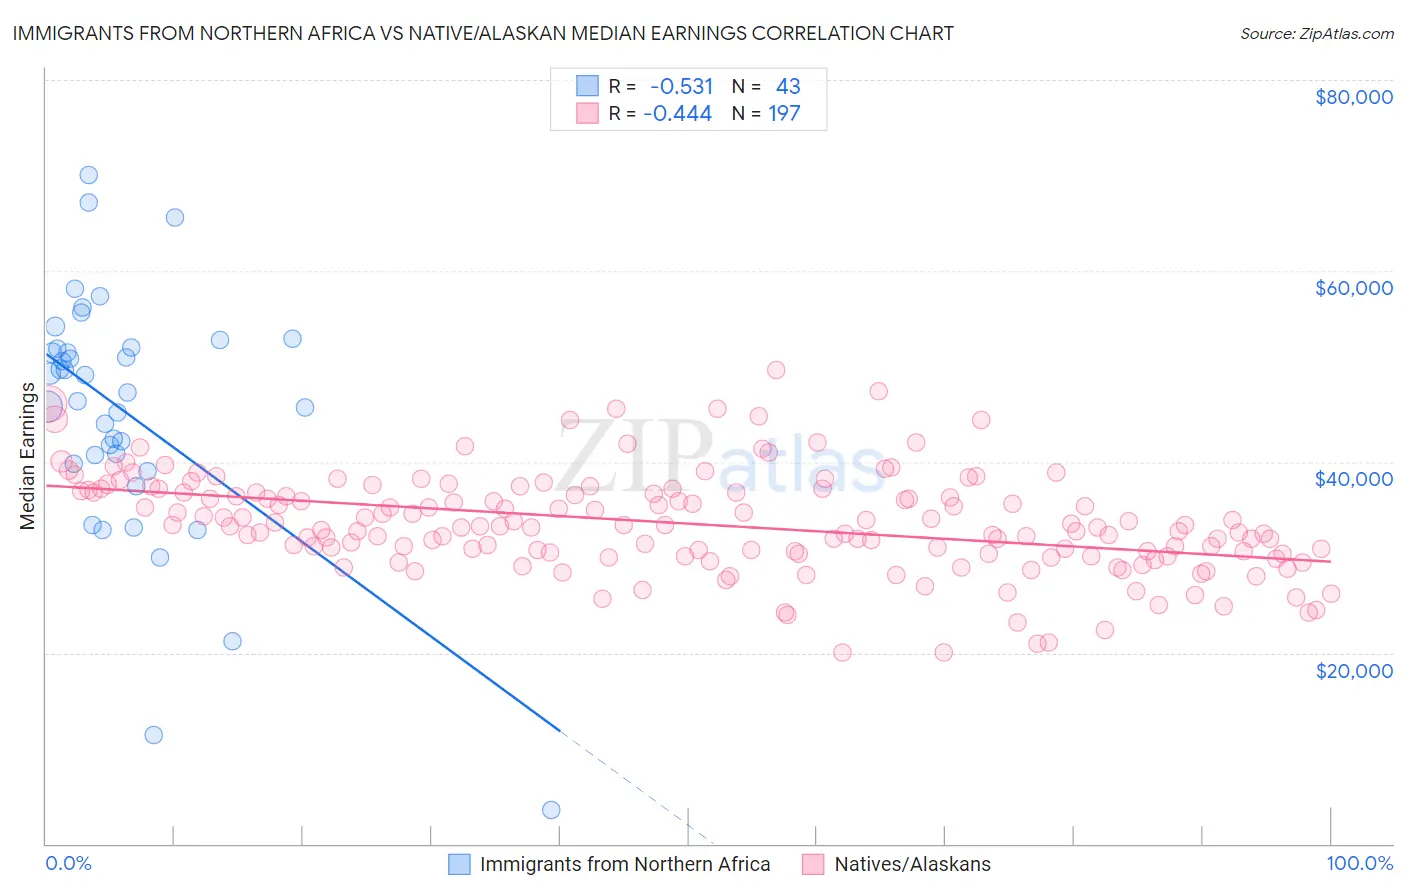
Immigrants from Northern Africa vs Native/Alaskan Median Earnings Correlation Chart
The statistical analysis conducted on geographies consisting of 321,196,666 people shows a substantial negative correlation between the proportion of Immigrants from Northern Africa and median earnings in the United States with a correlation coefficient (R) of -0.531 and weighted average of $49,648. Similarly, the statistical analysis conducted on geographies consisting of 512,831,083 people shows a moderate negative correlation between the proportion of Natives/Alaskans and median earnings in the United States with a correlation coefficient (R) of -0.444 and weighted average of $38,896, a difference of 27.6%.
Median Earnings Correlation Summary
| Measurement | Immigrants from Northern Africa | Native/Alaskan |
| Minimum | $3,500 | $20,036 |
| Maximum | $70,043 | $49,581 |
| Range | $66,543 | $29,544 |
| Mean | $45,203 | $33,526 |
| Median | $47,214 | $33,302 |
| Interquartile 25% (IQ1) | $39,837 | $30,416 |
| Interquartile 75% (IQ3) | $52,025 | $36,881 |
| Interquartile Range (IQR) | $12,188 | $6,465 |
| Standard Deviation (Sample) | $12,971 | $5,244 |
| Standard Deviation (Population) | $12,819 | $5,231 |
Similar Demographics by Median Earnings
Demographics Similar to Immigrants from Northern Africa by Median Earnings
In terms of median earnings, the demographic groups most similar to Immigrants from Northern Africa are Immigrants from Afghanistan ($49,645, a difference of 0.010%), Immigrants from North Macedonia ($49,658, a difference of 0.020%), Immigrants from Poland ($49,633, a difference of 0.030%), Jordanian ($49,632, a difference of 0.030%), and Immigrants from Lebanon ($49,682, a difference of 0.070%).
| Demographics | Rating | Rank | Median Earnings |
| Macedonians | 99.2 /100 | #91 | Exceptional $49,893 |
| Immigrants | Argentina | 99.2 /100 | #92 | Exceptional $49,841 |
| Armenians | 99.1 /100 | #93 | Exceptional $49,804 |
| Croatians | 99.0 /100 | #94 | Exceptional $49,724 |
| Immigrants | England | 99.0 /100 | #95 | Exceptional $49,722 |
| Immigrants | Lebanon | 99.0 /100 | #96 | Exceptional $49,682 |
| Immigrants | North Macedonia | 98.9 /100 | #97 | Exceptional $49,658 |
| Immigrants | Northern Africa | 98.9 /100 | #98 | Exceptional $49,648 |
| Immigrants | Afghanistan | 98.9 /100 | #99 | Exceptional $49,645 |
| Immigrants | Poland | 98.9 /100 | #100 | Exceptional $49,633 |
| Jordanians | 98.9 /100 | #101 | Exceptional $49,632 |
| Ethiopians | 98.8 /100 | #102 | Exceptional $49,572 |
| Austrians | 98.7 /100 | #103 | Exceptional $49,501 |
| Immigrants | Brazil | 98.6 /100 | #104 | Exceptional $49,463 |
| Immigrants | Western Asia | 98.4 /100 | #105 | Exceptional $49,389 |
Demographics Similar to Natives/Alaskans by Median Earnings
In terms of median earnings, the demographic groups most similar to Natives/Alaskans are Spanish American Indian ($38,907, a difference of 0.030%), Houma ($38,949, a difference of 0.14%), Crow ($38,707, a difference of 0.49%), Yakama ($39,107, a difference of 0.54%), and Immigrants from Mexico ($39,114, a difference of 0.56%).
| Demographics | Rating | Rank | Median Earnings |
| Sioux | 0.0 /100 | #328 | Tragic $39,448 |
| Kiowa | 0.0 /100 | #329 | Tragic $39,232 |
| Immigrants | Congo | 0.0 /100 | #330 | Tragic $39,169 |
| Immigrants | Mexico | 0.0 /100 | #331 | Tragic $39,114 |
| Yakama | 0.0 /100 | #332 | Tragic $39,107 |
| Houma | 0.0 /100 | #333 | Tragic $38,949 |
| Spanish American Indians | 0.0 /100 | #334 | Tragic $38,907 |
| Natives/Alaskans | 0.0 /100 | #335 | Tragic $38,896 |
| Crow | 0.0 /100 | #336 | Tragic $38,707 |
| Immigrants | Cuba | 0.0 /100 | #337 | Tragic $38,426 |
| Pima | 0.0 /100 | #338 | Tragic $38,285 |
| Menominee | 0.0 /100 | #339 | Tragic $37,884 |
| Navajo | 0.0 /100 | #340 | Tragic $36,999 |
| Lumbee | 0.0 /100 | #341 | Tragic $36,876 |
| Hopi | 0.0 /100 | #342 | Tragic $36,871 |