Immigrants from Malaysia vs Soviet Union Median Earnings
COMPARE
Immigrants from Malaysia
Soviet Union
Median Earnings
Median Earnings Comparison
Immigrants from Malaysia
Soviet Union
$52,514
MEDIAN EARNINGS
100.0/ 100
METRIC RATING
43rd/ 347
METRIC RANK
$54,290
MEDIAN EARNINGS
100.0/ 100
METRIC RATING
24th/ 347
METRIC RANK
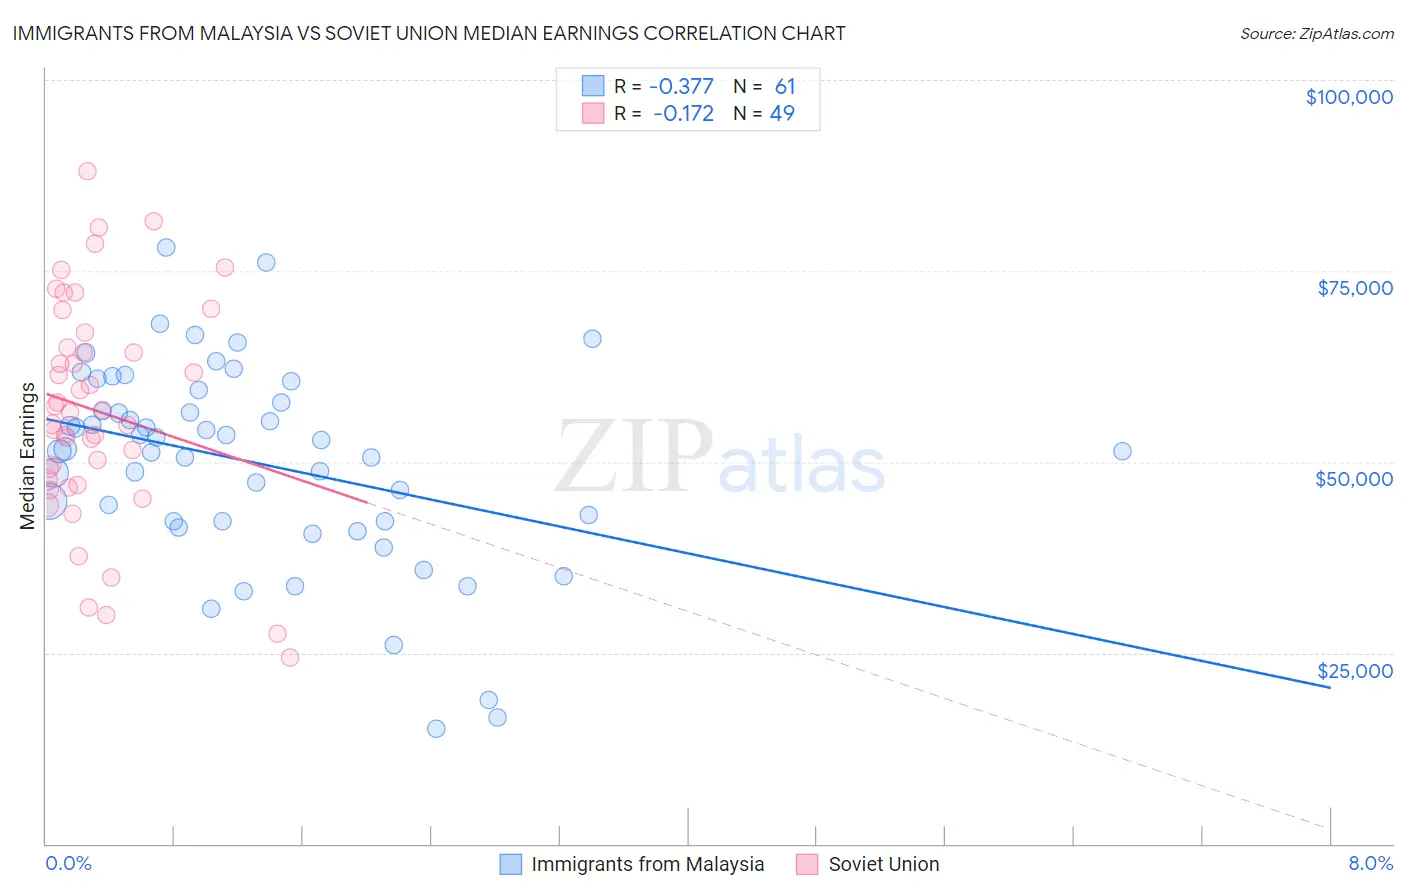
Immigrants from Malaysia vs Soviet Union Median Earnings Correlation Chart
The statistical analysis conducted on geographies consisting of 197,951,300 people shows a mild negative correlation between the proportion of Immigrants from Malaysia and median earnings in the United States with a correlation coefficient (R) of -0.377 and weighted average of $52,514. Similarly, the statistical analysis conducted on geographies consisting of 43,511,973 people shows a poor negative correlation between the proportion of Soviet Union and median earnings in the United States with a correlation coefficient (R) of -0.172 and weighted average of $54,290, a difference of 3.4%.
Median Earnings Correlation Summary
| Measurement | Immigrants from Malaysia | Soviet Union |
| Minimum | $15,000 | $24,432 |
| Maximum | $78,075 | $88,077 |
| Range | $63,075 | $63,645 |
| Mean | $49,921 | $56,673 |
| Median | $51,741 | $56,451 |
| Interquartile 25% (IQ1) | $42,220 | $47,287 |
| Interquartile 75% (IQ3) | $58,605 | $65,993 |
| Interquartile Range (IQR) | $16,385 | $18,706 |
| Standard Deviation (Sample) | $13,176 | $14,478 |
| Standard Deviation (Population) | $13,067 | $14,329 |
Demographics Similar to Immigrants from Malaysia and Soviet Union by Median Earnings
In terms of median earnings, the demographic groups most similar to Immigrants from Malaysia are Maltese ($52,526, a difference of 0.020%), Immigrants from Lithuania ($52,769, a difference of 0.49%), Israeli ($52,937, a difference of 0.80%), Immigrants from Turkey ($52,960, a difference of 0.85%), and Latvian ($53,001, a difference of 0.93%). Similarly, the demographic groups most similar to Soviet Union are Immigrants from Sweden ($54,478, a difference of 0.35%), Turkish ($53,919, a difference of 0.69%), Immigrants from Northern Europe ($53,872, a difference of 0.78%), Asian ($53,690, a difference of 1.1%), and Immigrants from France ($53,490, a difference of 1.5%).
| Demographics | Rating | Rank | Median Earnings |
| Immigrants | Sweden | 100.0 /100 | #23 | Exceptional $54,478 |
| Soviet Union | 100.0 /100 | #24 | Exceptional $54,290 |
| Turks | 100.0 /100 | #25 | Exceptional $53,919 |
| Immigrants | Northern Europe | 100.0 /100 | #26 | Exceptional $53,872 |
| Asians | 100.0 /100 | #27 | Exceptional $53,690 |
| Immigrants | France | 100.0 /100 | #28 | Exceptional $53,490 |
| Immigrants | Russia | 100.0 /100 | #29 | Exceptional $53,457 |
| Cambodians | 100.0 /100 | #30 | Exceptional $53,386 |
| Russians | 100.0 /100 | #31 | Exceptional $53,334 |
| Immigrants | Asia | 100.0 /100 | #32 | Exceptional $53,310 |
| Immigrants | Greece | 100.0 /100 | #33 | Exceptional $53,282 |
| Immigrants | Sri Lanka | 100.0 /100 | #34 | Exceptional $53,268 |
| Immigrants | Switzerland | 100.0 /100 | #35 | Exceptional $53,211 |
| Immigrants | Denmark | 100.0 /100 | #36 | Exceptional $53,186 |
| Immigrants | Belarus | 100.0 /100 | #37 | Exceptional $53,043 |
| Latvians | 100.0 /100 | #38 | Exceptional $53,001 |
| Immigrants | Turkey | 100.0 /100 | #39 | Exceptional $52,960 |
| Israelis | 100.0 /100 | #40 | Exceptional $52,937 |
| Immigrants | Lithuania | 100.0 /100 | #41 | Exceptional $52,769 |
| Maltese | 100.0 /100 | #42 | Exceptional $52,526 |
| Immigrants | Malaysia | 100.0 /100 | #43 | Exceptional $52,514 |