Immigrants from Northern Africa vs Argentinean Median Earnings
COMPARE
Immigrants from Northern Africa
Argentinean
Median Earnings
Median Earnings Comparison
Immigrants from Northern Africa
Argentineans
$49,648
MEDIAN EARNINGS
98.9/ 100
METRIC RATING
98th/ 347
METRIC RANK
$50,399
MEDIAN EARNINGS
99.6/ 100
METRIC RATING
78th/ 347
METRIC RANK
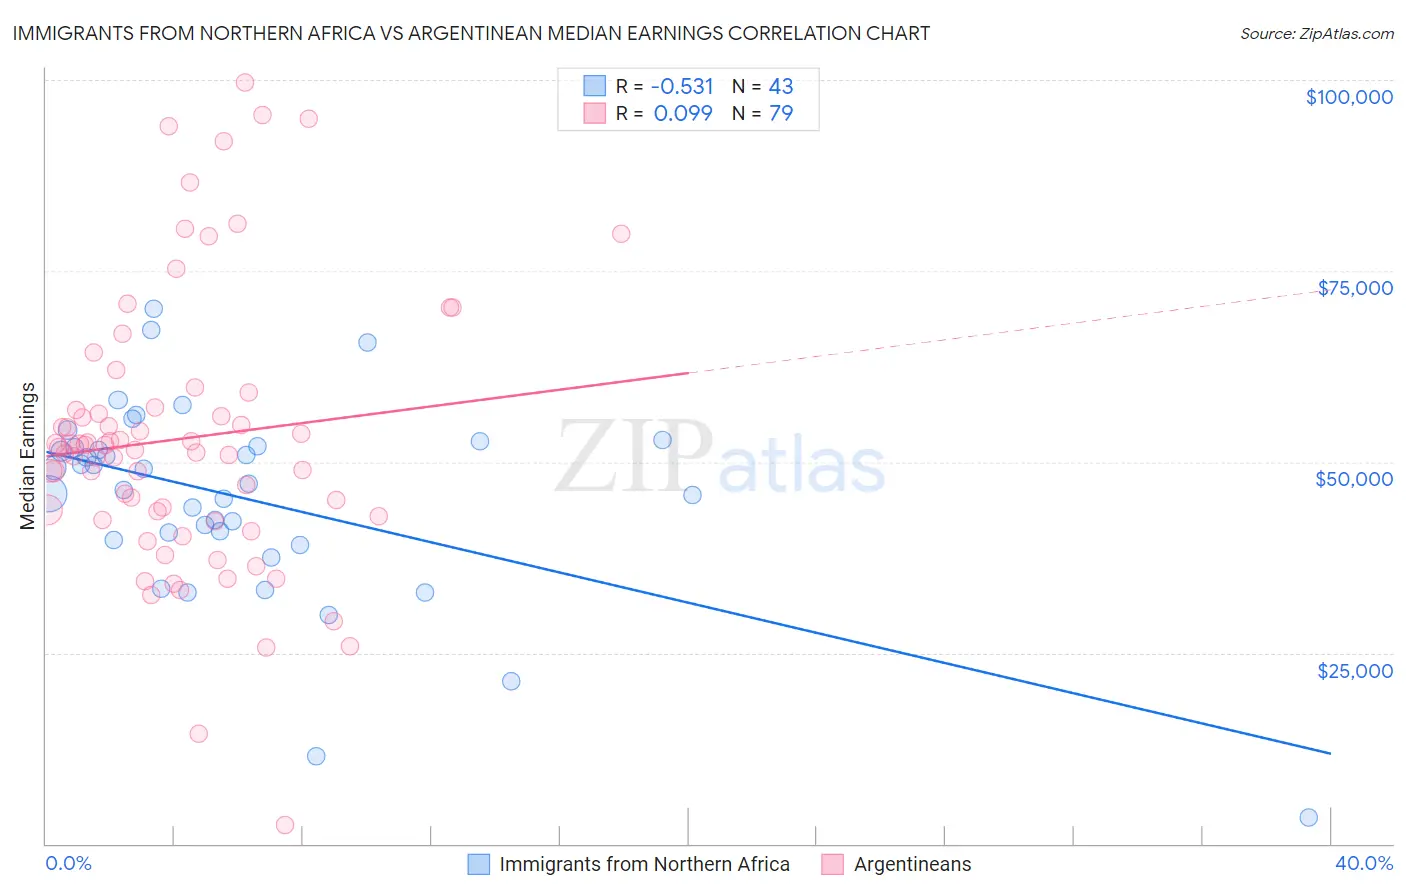
Immigrants from Northern Africa vs Argentinean Median Earnings Correlation Chart
The statistical analysis conducted on geographies consisting of 321,196,666 people shows a substantial negative correlation between the proportion of Immigrants from Northern Africa and median earnings in the United States with a correlation coefficient (R) of -0.531 and weighted average of $49,648. Similarly, the statistical analysis conducted on geographies consisting of 297,136,392 people shows a slight positive correlation between the proportion of Argentineans and median earnings in the United States with a correlation coefficient (R) of 0.099 and weighted average of $50,399, a difference of 1.5%.
Median Earnings Correlation Summary
| Measurement | Immigrants from Northern Africa | Argentinean |
| Minimum | $3,500 | $2,499 |
| Maximum | $70,043 | $99,706 |
| Range | $66,543 | $97,207 |
| Mean | $45,203 | $53,044 |
| Median | $47,214 | $51,898 |
| Interquartile 25% (IQ1) | $39,837 | $42,917 |
| Interquartile 75% (IQ3) | $52,025 | $57,109 |
| Interquartile Range (IQR) | $12,188 | $14,192 |
| Standard Deviation (Sample) | $12,971 | $18,063 |
| Standard Deviation (Population) | $12,819 | $17,948 |
Demographics Similar to Immigrants from Northern Africa and Argentineans by Median Earnings
In terms of median earnings, the demographic groups most similar to Immigrants from Northern Africa are Immigrants from North Macedonia ($49,658, a difference of 0.020%), Immigrants from Lebanon ($49,682, a difference of 0.070%), Croatian ($49,724, a difference of 0.15%), Immigrants from England ($49,722, a difference of 0.15%), and Armenian ($49,804, a difference of 0.31%). Similarly, the demographic groups most similar to Argentineans are Laotian ($50,343, a difference of 0.11%), Ukrainian ($50,320, a difference of 0.16%), Immigrants from Southern Europe ($50,280, a difference of 0.24%), Immigrants from Moldova ($50,274, a difference of 0.25%), and Romanian ($50,244, a difference of 0.31%).
| Demographics | Rating | Rank | Median Earnings |
| Argentineans | 99.6 /100 | #78 | Exceptional $50,399 |
| Laotians | 99.6 /100 | #79 | Exceptional $50,343 |
| Ukrainians | 99.6 /100 | #80 | Exceptional $50,320 |
| Immigrants | Southern Europe | 99.6 /100 | #81 | Exceptional $50,280 |
| Immigrants | Moldova | 99.5 /100 | #82 | Exceptional $50,274 |
| Romanians | 99.5 /100 | #83 | Exceptional $50,244 |
| Immigrants | Hungary | 99.5 /100 | #84 | Exceptional $50,227 |
| Immigrants | Kazakhstan | 99.5 /100 | #85 | Exceptional $50,225 |
| Immigrants | Canada | 99.5 /100 | #86 | Exceptional $50,192 |
| Immigrants | Uzbekistan | 99.5 /100 | #87 | Exceptional $50,151 |
| Albanians | 99.4 /100 | #88 | Exceptional $50,116 |
| Immigrants | North America | 99.4 /100 | #89 | Exceptional $50,108 |
| Italians | 99.3 /100 | #90 | Exceptional $49,915 |
| Macedonians | 99.2 /100 | #91 | Exceptional $49,893 |
| Immigrants | Argentina | 99.2 /100 | #92 | Exceptional $49,841 |
| Armenians | 99.1 /100 | #93 | Exceptional $49,804 |
| Croatians | 99.0 /100 | #94 | Exceptional $49,724 |
| Immigrants | England | 99.0 /100 | #95 | Exceptional $49,722 |
| Immigrants | Lebanon | 99.0 /100 | #96 | Exceptional $49,682 |
| Immigrants | North Macedonia | 98.9 /100 | #97 | Exceptional $49,658 |
| Immigrants | Northern Africa | 98.9 /100 | #98 | Exceptional $49,648 |