Immigrants from Haiti vs Soviet Union Median Earnings
COMPARE
Immigrants from Haiti
Soviet Union
Median Earnings
Median Earnings Comparison
Immigrants from Haiti
Soviet Union
$40,550
MEDIAN EARNINGS
0.0/ 100
METRIC RATING
309th/ 347
METRIC RANK
$54,290
MEDIAN EARNINGS
100.0/ 100
METRIC RATING
24th/ 347
METRIC RANK
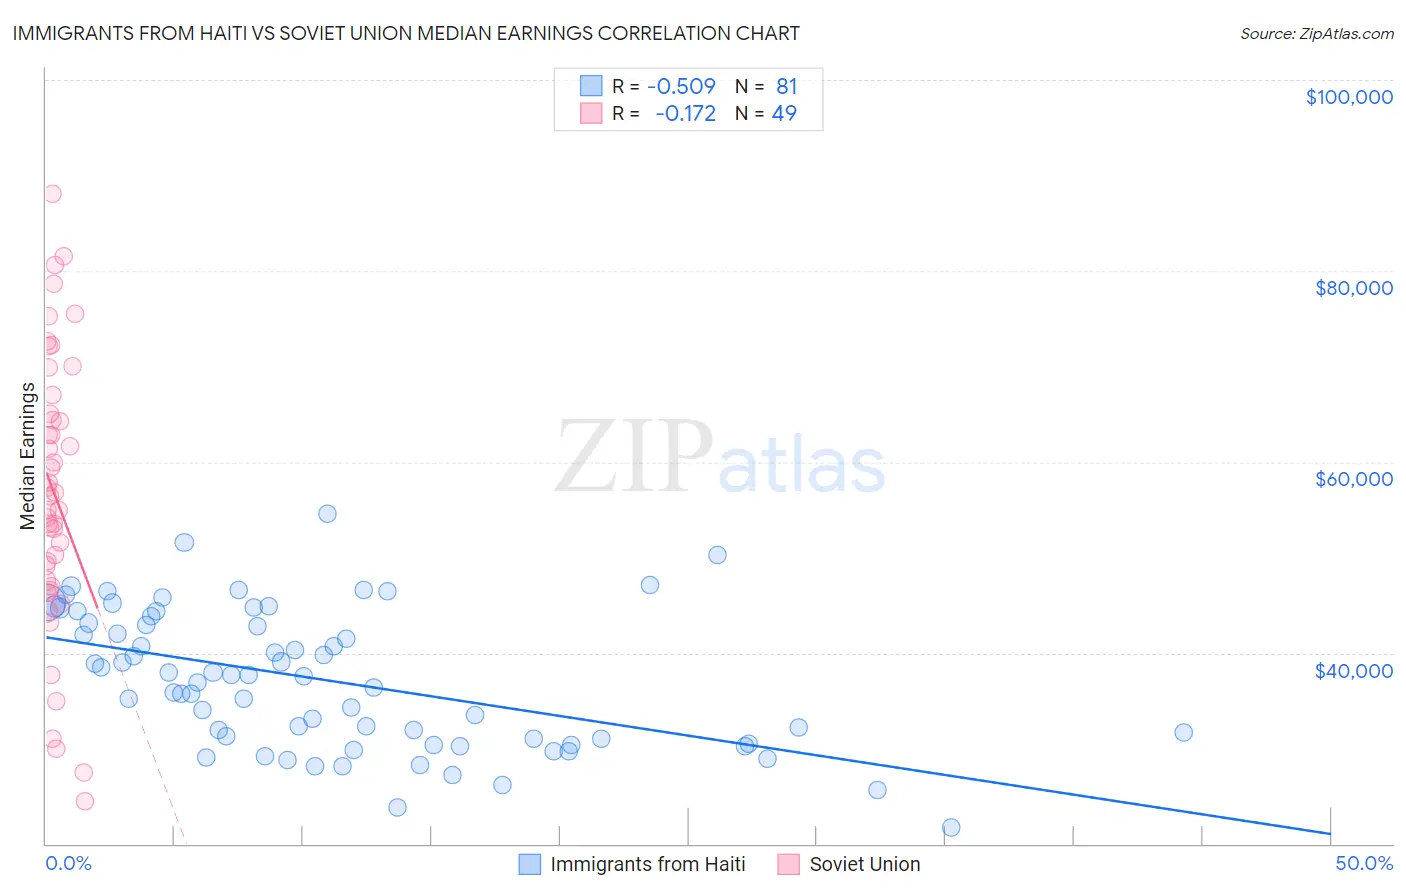
Immigrants from Haiti vs Soviet Union Median Earnings Correlation Chart
The statistical analysis conducted on geographies consisting of 225,267,709 people shows a substantial negative correlation between the proportion of Immigrants from Haiti and median earnings in the United States with a correlation coefficient (R) of -0.509 and weighted average of $40,550. Similarly, the statistical analysis conducted on geographies consisting of 43,511,973 people shows a poor negative correlation between the proportion of Soviet Union and median earnings in the United States with a correlation coefficient (R) of -0.172 and weighted average of $54,290, a difference of 33.9%.
Median Earnings Correlation Summary
| Measurement | Immigrants from Haiti | Soviet Union |
| Minimum | $21,741 | $24,432 |
| Maximum | $54,545 | $88,077 |
| Range | $32,804 | $63,645 |
| Mean | $37,122 | $56,673 |
| Median | $37,540 | $56,451 |
| Interquartile 25% (IQ1) | $30,770 | $47,287 |
| Interquartile 75% (IQ3) | $43,463 | $65,993 |
| Interquartile Range (IQR) | $12,693 | $18,706 |
| Standard Deviation (Sample) | $7,185 | $14,478 |
| Standard Deviation (Population) | $7,140 | $14,329 |
Similar Demographics by Median Earnings
Demographics Similar to Immigrants from Haiti by Median Earnings
In terms of median earnings, the demographic groups most similar to Immigrants from Haiti are Cuban ($40,619, a difference of 0.17%), Honduran ($40,638, a difference of 0.22%), Yaqui ($40,647, a difference of 0.24%), Chickasaw ($40,672, a difference of 0.30%), and Apache ($40,388, a difference of 0.40%).
| Demographics | Rating | Rank | Median Earnings |
| Shoshone | 0.0 /100 | #302 | Tragic $40,932 |
| Haitians | 0.0 /100 | #303 | Tragic $40,918 |
| Immigrants | Guatemala | 0.0 /100 | #304 | Tragic $40,851 |
| Chickasaw | 0.0 /100 | #305 | Tragic $40,672 |
| Yaqui | 0.0 /100 | #306 | Tragic $40,647 |
| Hondurans | 0.0 /100 | #307 | Tragic $40,638 |
| Cubans | 0.0 /100 | #308 | Tragic $40,619 |
| Immigrants | Haiti | 0.0 /100 | #309 | Tragic $40,550 |
| Apache | 0.0 /100 | #310 | Tragic $40,388 |
| Hispanics or Latinos | 0.0 /100 | #311 | Tragic $40,288 |
| Chippewa | 0.0 /100 | #312 | Tragic $40,287 |
| Choctaw | 0.0 /100 | #313 | Tragic $40,270 |
| Cheyenne | 0.0 /100 | #314 | Tragic $40,233 |
| Seminole | 0.0 /100 | #315 | Tragic $40,233 |
| Immigrants | Honduras | 0.0 /100 | #316 | Tragic $40,195 |
Demographics Similar to Soviet Union by Median Earnings
In terms of median earnings, the demographic groups most similar to Soviet Union are Immigrants from Sweden ($54,478, a difference of 0.35%), Immigrants from Korea ($54,530, a difference of 0.44%), Burmese ($54,559, a difference of 0.50%), Cypriot ($54,589, a difference of 0.55%), and Turkish ($53,919, a difference of 0.69%).
| Demographics | Rating | Rank | Median Earnings |
| Eastern Europeans | 100.0 /100 | #17 | Exceptional $55,084 |
| Immigrants | Japan | 100.0 /100 | #18 | Exceptional $54,938 |
| Immigrants | Belgium | 100.0 /100 | #19 | Exceptional $54,679 |
| Cypriots | 100.0 /100 | #20 | Exceptional $54,589 |
| Burmese | 100.0 /100 | #21 | Exceptional $54,559 |
| Immigrants | Korea | 100.0 /100 | #22 | Exceptional $54,530 |
| Immigrants | Sweden | 100.0 /100 | #23 | Exceptional $54,478 |
| Soviet Union | 100.0 /100 | #24 | Exceptional $54,290 |
| Turks | 100.0 /100 | #25 | Exceptional $53,919 |
| Immigrants | Northern Europe | 100.0 /100 | #26 | Exceptional $53,872 |
| Asians | 100.0 /100 | #27 | Exceptional $53,690 |
| Immigrants | France | 100.0 /100 | #28 | Exceptional $53,490 |
| Immigrants | Russia | 100.0 /100 | #29 | Exceptional $53,457 |
| Cambodians | 100.0 /100 | #30 | Exceptional $53,386 |
| Russians | 100.0 /100 | #31 | Exceptional $53,334 |