Immigrants from Switzerland vs Soviet Union Median Earnings
COMPARE
Immigrants from Switzerland
Soviet Union
Median Earnings
Median Earnings Comparison
Immigrants from Switzerland
Soviet Union
$53,211
MEDIAN EARNINGS
100.0/ 100
METRIC RATING
35th/ 347
METRIC RANK
$54,290
MEDIAN EARNINGS
100.0/ 100
METRIC RATING
24th/ 347
METRIC RANK
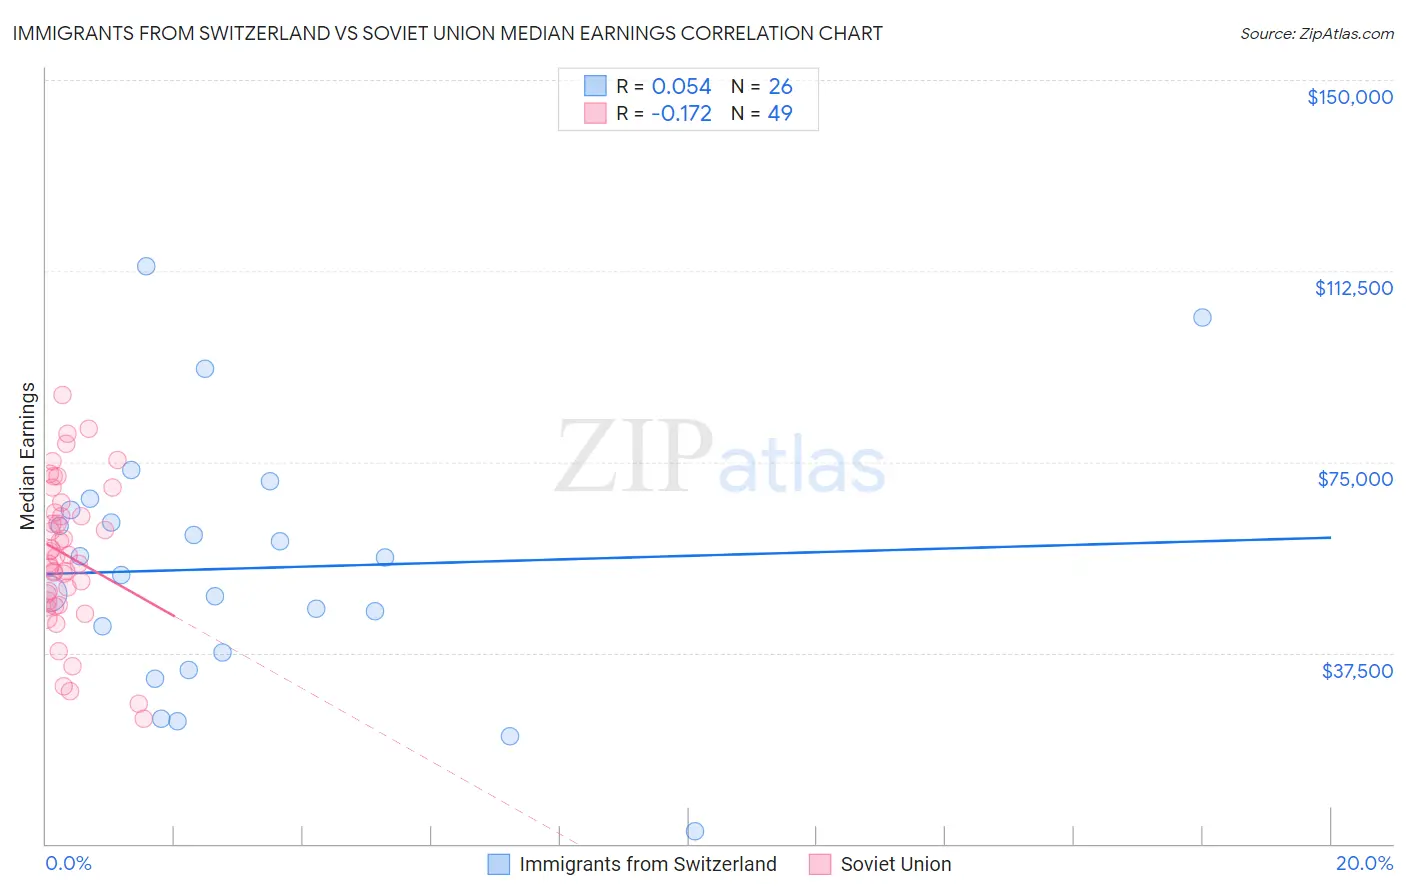
Immigrants from Switzerland vs Soviet Union Median Earnings Correlation Chart
The statistical analysis conducted on geographies consisting of 148,076,857 people shows a slight positive correlation between the proportion of Immigrants from Switzerland and median earnings in the United States with a correlation coefficient (R) of 0.054 and weighted average of $53,211. Similarly, the statistical analysis conducted on geographies consisting of 43,511,973 people shows a poor negative correlation between the proportion of Soviet Union and median earnings in the United States with a correlation coefficient (R) of -0.172 and weighted average of $54,290, a difference of 2.0%.
Median Earnings Correlation Summary
| Measurement | Immigrants from Switzerland | Soviet Union |
| Minimum | $2,499 | $24,432 |
| Maximum | $113,419 | $88,077 |
| Range | $110,920 | $63,645 |
| Mean | $54,118 | $56,673 |
| Median | $54,480 | $56,451 |
| Interquartile 25% (IQ1) | $37,656 | $47,287 |
| Interquartile 75% (IQ3) | $65,606 | $65,993 |
| Interquartile Range (IQR) | $27,950 | $18,706 |
| Standard Deviation (Sample) | $25,059 | $14,478 |
| Standard Deviation (Population) | $24,573 | $14,329 |
Demographics Similar to Immigrants from Switzerland and Soviet Union by Median Earnings
In terms of median earnings, the demographic groups most similar to Immigrants from Switzerland are Immigrants from Denmark ($53,186, a difference of 0.050%), Immigrants from Sri Lanka ($53,268, a difference of 0.11%), Immigrants from Greece ($53,282, a difference of 0.13%), Immigrants from Asia ($53,310, a difference of 0.19%), and Russian ($53,334, a difference of 0.23%). Similarly, the demographic groups most similar to Soviet Union are Immigrants from Sweden ($54,478, a difference of 0.35%), Immigrants from Korea ($54,530, a difference of 0.44%), Burmese ($54,559, a difference of 0.50%), Cypriot ($54,589, a difference of 0.55%), and Turkish ($53,919, a difference of 0.69%).
| Demographics | Rating | Rank | Median Earnings |
| Immigrants | Belgium | 100.0 /100 | #19 | Exceptional $54,679 |
| Cypriots | 100.0 /100 | #20 | Exceptional $54,589 |
| Burmese | 100.0 /100 | #21 | Exceptional $54,559 |
| Immigrants | Korea | 100.0 /100 | #22 | Exceptional $54,530 |
| Immigrants | Sweden | 100.0 /100 | #23 | Exceptional $54,478 |
| Soviet Union | 100.0 /100 | #24 | Exceptional $54,290 |
| Turks | 100.0 /100 | #25 | Exceptional $53,919 |
| Immigrants | Northern Europe | 100.0 /100 | #26 | Exceptional $53,872 |
| Asians | 100.0 /100 | #27 | Exceptional $53,690 |
| Immigrants | France | 100.0 /100 | #28 | Exceptional $53,490 |
| Immigrants | Russia | 100.0 /100 | #29 | Exceptional $53,457 |
| Cambodians | 100.0 /100 | #30 | Exceptional $53,386 |
| Russians | 100.0 /100 | #31 | Exceptional $53,334 |
| Immigrants | Asia | 100.0 /100 | #32 | Exceptional $53,310 |
| Immigrants | Greece | 100.0 /100 | #33 | Exceptional $53,282 |
| Immigrants | Sri Lanka | 100.0 /100 | #34 | Exceptional $53,268 |
| Immigrants | Switzerland | 100.0 /100 | #35 | Exceptional $53,211 |
| Immigrants | Denmark | 100.0 /100 | #36 | Exceptional $53,186 |
| Immigrants | Belarus | 100.0 /100 | #37 | Exceptional $53,043 |
| Latvians | 100.0 /100 | #38 | Exceptional $53,001 |
| Immigrants | Turkey | 100.0 /100 | #39 | Exceptional $52,960 |