Immigrants from Nigeria vs Black/African American Wage/Income Gap
COMPARE
Immigrants from Nigeria
Black/African American
Wage/Income Gap
Wage/Income Gap Comparison
Immigrants from Nigeria
Blacks/African Americans
22.7%
WAGE/INCOME GAP
99.9/ 100
METRIC RATING
68th/ 347
METRIC RANK
21.7%
WAGE/INCOME GAP
100.0/ 100
METRIC RATING
48th/ 347
METRIC RANK
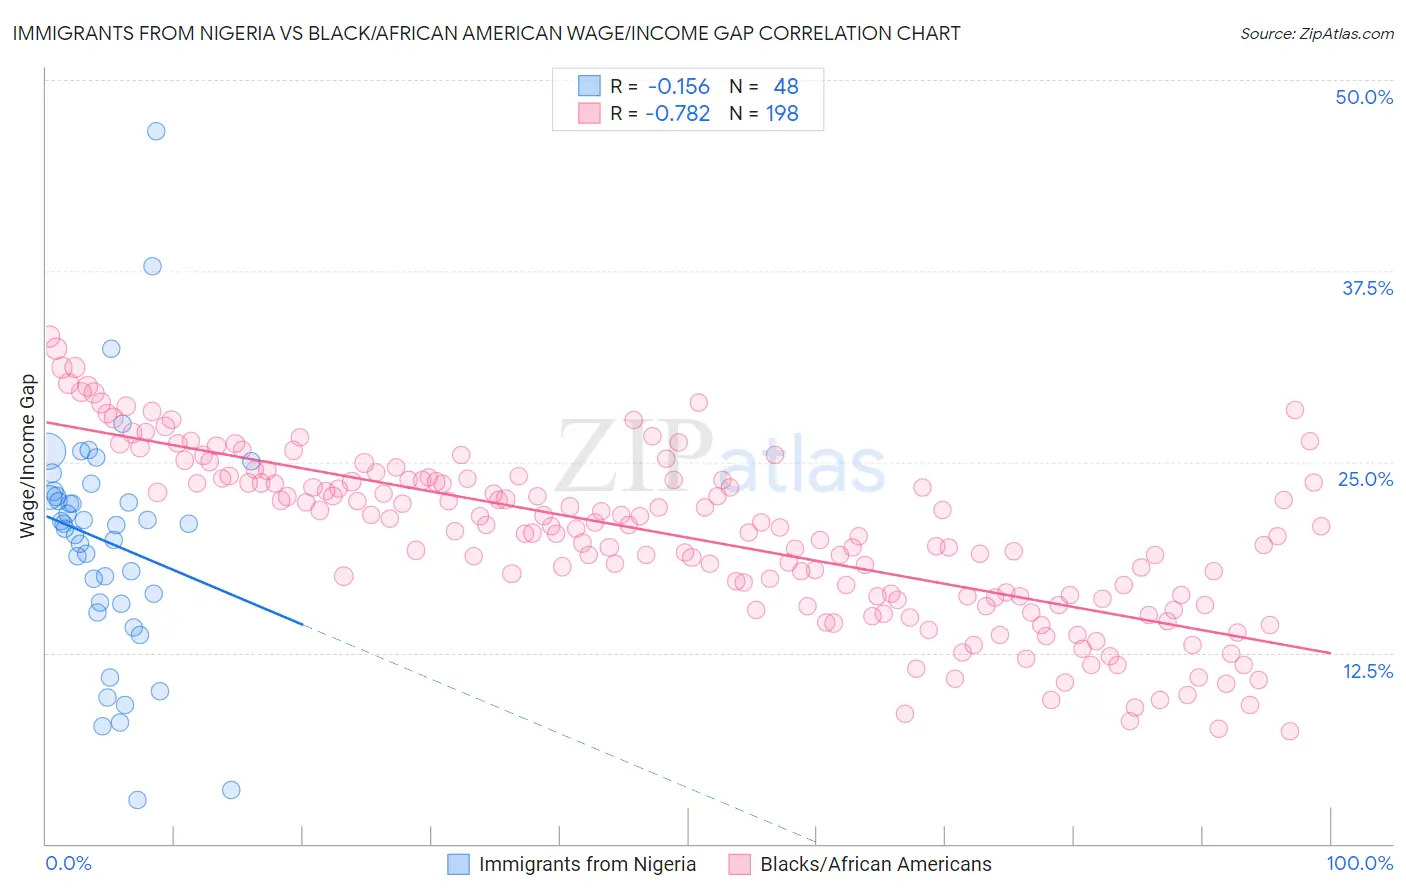
Immigrants from Nigeria vs Black/African American Wage/Income Gap Correlation Chart
The statistical analysis conducted on geographies consisting of 283,442,522 people shows a poor negative correlation between the proportion of Immigrants from Nigeria and wage/income gap percentage in the United States with a correlation coefficient (R) of -0.156 and weighted average of 22.7%. Similarly, the statistical analysis conducted on geographies consisting of 563,586,273 people shows a strong negative correlation between the proportion of Blacks/African Americans and wage/income gap percentage in the United States with a correlation coefficient (R) of -0.782 and weighted average of 21.7%, a difference of 4.6%.
Wage/Income Gap Correlation Summary
| Measurement | Immigrants from Nigeria | Black/African American |
| Minimum | 2.9% | 7.4% |
| Maximum | 46.7% | 33.2% |
| Range | 43.8% | 25.8% |
| Mean | 19.8% | 20.1% |
| Median | 20.9% | 20.7% |
| Interquartile 25% (IQ1) | 15.8% | 16.1% |
| Interquartile 75% (IQ3) | 22.9% | 23.8% |
| Interquartile Range (IQR) | 7.2% | 7.7% |
| Standard Deviation (Sample) | 7.9% | 5.5% |
| Standard Deviation (Population) | 7.8% | 5.5% |
Demographics Similar to Immigrants from Nigeria and Blacks/African Americans by Wage/Income Gap
In terms of wage/income gap, the demographic groups most similar to Immigrants from Nigeria are Menominee (22.7%, a difference of 0.0%), Central American Indian (22.7%, a difference of 0.18%), Guatemalan (22.6%, a difference of 0.42%), Spanish American Indian (22.5%, a difference of 0.74%), and Immigrants from Ecuador (22.5%, a difference of 1.0%). Similarly, the demographic groups most similar to Blacks/African Americans are Ethiopian (21.8%, a difference of 0.51%), Immigrants from Western Africa (22.0%, a difference of 1.5%), Tohono O'odham (22.1%, a difference of 1.9%), Immigrants from Cameroon (22.2%, a difference of 2.0%), and Bangladeshi (22.2%, a difference of 2.0%).
| Demographics | Rating | Rank | Wage/Income Gap |
| Blacks/African Americans | 100.0 /100 | #48 | Exceptional 21.7% |
| Ethiopians | 100.0 /100 | #49 | Exceptional 21.8% |
| Immigrants | Western Africa | 100.0 /100 | #50 | Exceptional 22.0% |
| Tohono O'odham | 100.0 /100 | #51 | Exceptional 22.1% |
| Immigrants | Cameroon | 100.0 /100 | #52 | Exceptional 22.2% |
| Bangladeshis | 100.0 /100 | #53 | Exceptional 22.2% |
| Nepalese | 100.0 /100 | #54 | Exceptional 22.2% |
| Immigrants | Zaire | 100.0 /100 | #55 | Exceptional 22.3% |
| Immigrants | Ghana | 100.0 /100 | #56 | Exceptional 22.3% |
| Ghanaians | 100.0 /100 | #57 | Exceptional 22.3% |
| Immigrants | Cuba | 100.0 /100 | #58 | Exceptional 22.4% |
| Navajo | 100.0 /100 | #59 | Exceptional 22.4% |
| Immigrants | Middle Africa | 100.0 /100 | #60 | Exceptional 22.4% |
| Immigrants | Fiji | 100.0 /100 | #61 | Exceptional 22.4% |
| Immigrants | Guatemala | 100.0 /100 | #62 | Exceptional 22.5% |
| Immigrants | Ecuador | 100.0 /100 | #63 | Exceptional 22.5% |
| Spanish American Indians | 100.0 /100 | #64 | Exceptional 22.5% |
| Guatemalans | 99.9 /100 | #65 | Exceptional 22.6% |
| Central American Indians | 99.9 /100 | #66 | Exceptional 22.7% |
| Menominee | 99.9 /100 | #67 | Exceptional 22.7% |
| Immigrants | Nigeria | 99.9 /100 | #68 | Exceptional 22.7% |