Inupiat vs Black/African American Wage/Income Gap
COMPARE
Inupiat
Black/African American
Wage/Income Gap
Wage/Income Gap Comparison
Inupiat
Blacks/African Americans
20.8%
WAGE/INCOME GAP
100.0/ 100
METRIC RATING
28th/ 347
METRIC RANK
21.7%
WAGE/INCOME GAP
100.0/ 100
METRIC RATING
48th/ 347
METRIC RANK
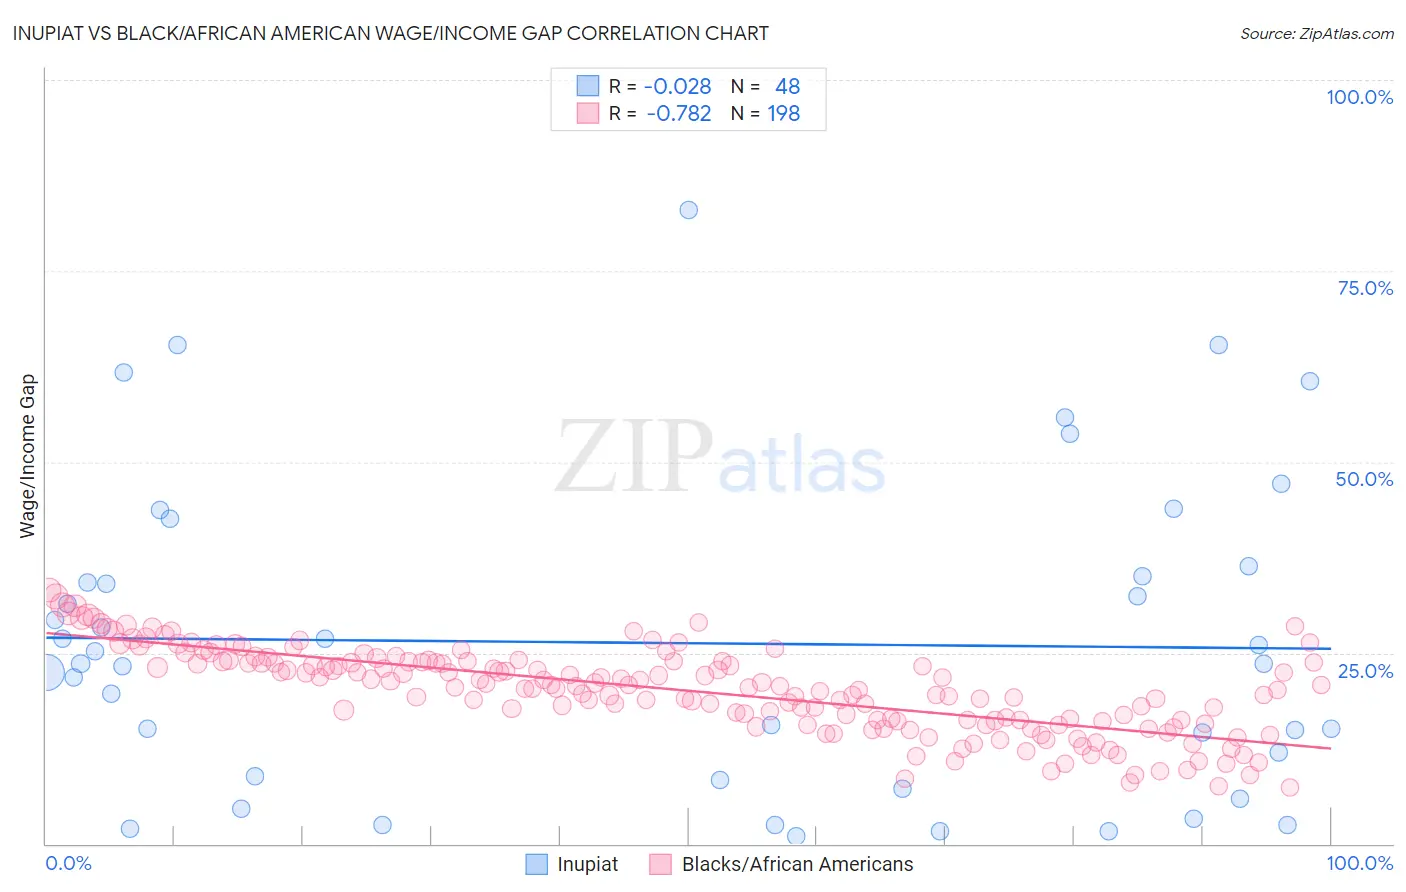
Inupiat vs Black/African American Wage/Income Gap Correlation Chart
The statistical analysis conducted on geographies consisting of 96,290,792 people shows no correlation between the proportion of Inupiat and wage/income gap percentage in the United States with a correlation coefficient (R) of -0.028 and weighted average of 20.8%. Similarly, the statistical analysis conducted on geographies consisting of 563,586,273 people shows a strong negative correlation between the proportion of Blacks/African Americans and wage/income gap percentage in the United States with a correlation coefficient (R) of -0.782 and weighted average of 21.7%, a difference of 4.6%.
Wage/Income Gap Correlation Summary
| Measurement | Inupiat | Black/African American |
| Minimum | 0.97% | 7.4% |
| Maximum | 83.0% | 33.2% |
| Range | 82.0% | 25.8% |
| Mean | 26.3% | 20.1% |
| Median | 23.6% | 20.7% |
| Interquartile 25% (IQ1) | 8.6% | 16.1% |
| Interquartile 75% (IQ3) | 35.7% | 23.8% |
| Interquartile Range (IQR) | 27.1% | 7.7% |
| Standard Deviation (Sample) | 20.4% | 5.5% |
| Standard Deviation (Population) | 20.2% | 5.5% |
Demographics Similar to Inupiat and Blacks/African Americans by Wage/Income Gap
In terms of wage/income gap, the demographic groups most similar to Inupiat are Immigrants from Senegal (20.9%, a difference of 0.62%), Immigrants from Bangladesh (20.9%, a difference of 0.84%), Vietnamese (21.0%, a difference of 1.1%), Immigrants from Yemen (21.1%, a difference of 1.4%), and Immigrants from Bahamas (21.1%, a difference of 1.4%). Similarly, the demographic groups most similar to Blacks/African Americans are Immigrants from Congo (21.7%, a difference of 0.18%), Immigrants from Ethiopia (21.6%, a difference of 0.73%), U.S. Virgin Islander (21.5%, a difference of 0.85%), Immigrants from Eritrea (21.4%, a difference of 1.3%), and Sierra Leonean (21.4%, a difference of 1.3%).
| Demographics | Rating | Rank | Wage/Income Gap |
| Inupiat | 100.0 /100 | #28 | Exceptional 20.8% |
| Immigrants | Senegal | 100.0 /100 | #29 | Exceptional 20.9% |
| Immigrants | Bangladesh | 100.0 /100 | #30 | Exceptional 20.9% |
| Vietnamese | 100.0 /100 | #31 | Exceptional 21.0% |
| Immigrants | Yemen | 100.0 /100 | #32 | Exceptional 21.1% |
| Immigrants | Bahamas | 100.0 /100 | #33 | Exceptional 21.1% |
| Pima | 100.0 /100 | #34 | Exceptional 21.1% |
| Somalis | 100.0 /100 | #35 | Exceptional 21.2% |
| Belizeans | 100.0 /100 | #36 | Exceptional 21.2% |
| Immigrants | Somalia | 100.0 /100 | #37 | Exceptional 21.2% |
| Immigrants | Belize | 100.0 /100 | #38 | Exceptional 21.3% |
| Colville | 100.0 /100 | #39 | Exceptional 21.3% |
| Lumbee | 100.0 /100 | #40 | Exceptional 21.3% |
| Liberians | 100.0 /100 | #41 | Exceptional 21.4% |
| Immigrants | Sierra Leone | 100.0 /100 | #42 | Exceptional 21.4% |
| Sierra Leoneans | 100.0 /100 | #43 | Exceptional 21.4% |
| Immigrants | Eritrea | 100.0 /100 | #44 | Exceptional 21.4% |
| U.S. Virgin Islanders | 100.0 /100 | #45 | Exceptional 21.5% |
| Immigrants | Ethiopia | 100.0 /100 | #46 | Exceptional 21.6% |
| Immigrants | Congo | 100.0 /100 | #47 | Exceptional 21.7% |
| Blacks/African Americans | 100.0 /100 | #48 | Exceptional 21.7% |