Immigrants from Nigeria vs Black/African American Associate's Degree
COMPARE
Immigrants from Nigeria
Black/African American
Associate's Degree
Associate's Degree Comparison
Immigrants from Nigeria
Blacks/African Americans
44.6%
ASSOCIATE'S DEGREE
11.4/ 100
METRIC RATING
216th/ 347
METRIC RANK
39.1%
ASSOCIATE'S DEGREE
0.0/ 100
METRIC RATING
292nd/ 347
METRIC RANK
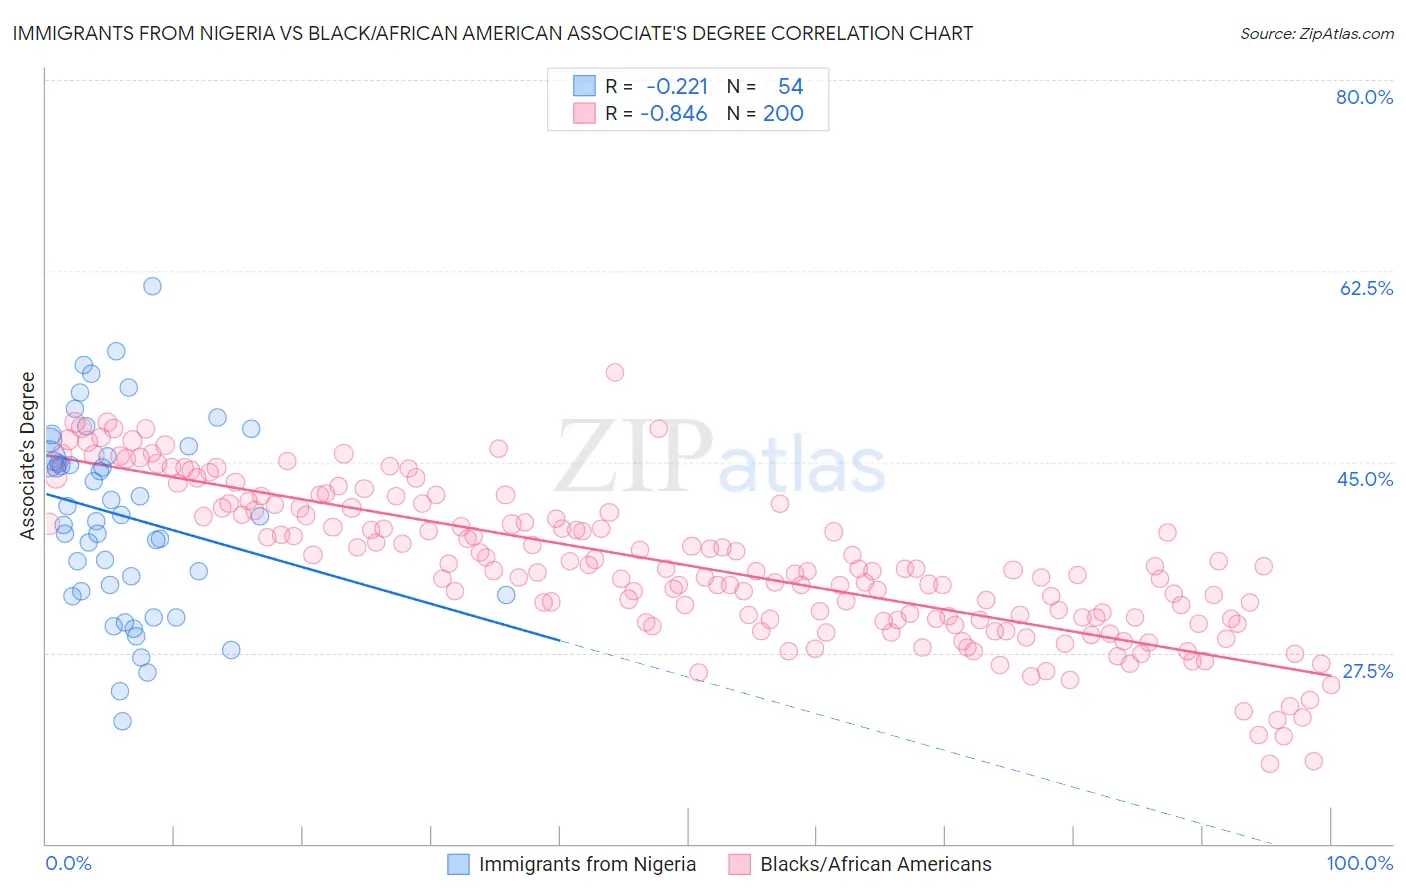
Immigrants from Nigeria vs Black/African American Associate's Degree Correlation Chart
The statistical analysis conducted on geographies consisting of 283,469,524 people shows a weak negative correlation between the proportion of Immigrants from Nigeria and percentage of population with at least associate's degree education in the United States with a correlation coefficient (R) of -0.221 and weighted average of 44.6%. Similarly, the statistical analysis conducted on geographies consisting of 565,941,999 people shows a very strong negative correlation between the proportion of Blacks/African Americans and percentage of population with at least associate's degree education in the United States with a correlation coefficient (R) of -0.846 and weighted average of 39.1%, a difference of 13.9%.
Associate's Degree Correlation Summary
| Measurement | Immigrants from Nigeria | Black/African American |
| Minimum | 21.3% | 17.4% |
| Maximum | 61.1% | 53.2% |
| Range | 39.8% | 35.8% |
| Mean | 40.0% | 35.5% |
| Median | 40.0% | 35.1% |
| Interquartile 25% (IQ1) | 33.2% | 30.6% |
| Interquartile 75% (IQ3) | 45.5% | 40.7% |
| Interquartile Range (IQR) | 12.3% | 10.1% |
| Standard Deviation (Sample) | 8.7% | 6.9% |
| Standard Deviation (Population) | 8.6% | 6.9% |
Similar Demographics by Associate's Degree
Demographics Similar to Immigrants from Nigeria by Associate's Degree
In terms of associate's degree, the demographic groups most similar to Immigrants from Nigeria are Immigrants from Panama (44.7%, a difference of 0.18%), Immigrants (44.5%, a difference of 0.19%), Immigrants from Middle Africa (44.7%, a difference of 0.24%), Spanish (44.4%, a difference of 0.43%), and Immigrants from Ghana (44.8%, a difference of 0.49%).
| Demographics | Rating | Rank | Associate's Degree |
| Immigrants | Costa Rica | 16.7 /100 | #209 | Poor 45.0% |
| Immigrants | Philippines | 16.7 /100 | #210 | Poor 45.0% |
| Immigrants | Zaire | 16.6 /100 | #211 | Poor 45.0% |
| French Canadians | 15.0 /100 | #212 | Poor 44.9% |
| Immigrants | Ghana | 14.2 /100 | #213 | Poor 44.8% |
| Immigrants | Middle Africa | 12.7 /100 | #214 | Poor 44.7% |
| Immigrants | Panama | 12.4 /100 | #215 | Poor 44.7% |
| Immigrants | Nigeria | 11.4 /100 | #216 | Poor 44.6% |
| Immigrants | Immigrants | 10.5 /100 | #217 | Poor 44.5% |
| Spanish | 9.4 /100 | #218 | Tragic 44.4% |
| Whites/Caucasians | 7.5 /100 | #219 | Tragic 44.2% |
| Portuguese | 7.2 /100 | #220 | Tragic 44.1% |
| Immigrants | Western Africa | 6.6 /100 | #221 | Tragic 44.1% |
| Barbadians | 5.8 /100 | #222 | Tragic 43.9% |
| Sub-Saharan Africans | 5.5 /100 | #223 | Tragic 43.9% |
Demographics Similar to Blacks/African Americans by Associate's Degree
In terms of associate's degree, the demographic groups most similar to Blacks/African Americans are Nepalese (39.0%, a difference of 0.25%), Salvadoran (39.0%, a difference of 0.25%), Dominican (39.3%, a difference of 0.29%), Immigrants from Haiti (39.3%, a difference of 0.30%), and Honduran (38.9%, a difference of 0.54%).
| Demographics | Rating | Rank | Associate's Degree |
| Immigrants | Belize | 0.1 /100 | #285 | Tragic 39.9% |
| Immigrants | Caribbean | 0.0 /100 | #286 | Tragic 39.7% |
| Aleuts | 0.0 /100 | #287 | Tragic 39.6% |
| Immigrants | Cuba | 0.0 /100 | #288 | Tragic 39.5% |
| Central Americans | 0.0 /100 | #289 | Tragic 39.4% |
| Immigrants | Haiti | 0.0 /100 | #290 | Tragic 39.3% |
| Dominicans | 0.0 /100 | #291 | Tragic 39.3% |
| Blacks/African Americans | 0.0 /100 | #292 | Tragic 39.1% |
| Nepalese | 0.0 /100 | #293 | Tragic 39.0% |
| Salvadorans | 0.0 /100 | #294 | Tragic 39.0% |
| Hondurans | 0.0 /100 | #295 | Tragic 38.9% |
| Cherokee | 0.0 /100 | #296 | Tragic 38.9% |
| Cape Verdeans | 0.0 /100 | #297 | Tragic 38.8% |
| Cheyenne | 0.0 /100 | #298 | Tragic 38.7% |
| Ute | 0.0 /100 | #299 | Tragic 38.6% |