Immigrants from Middle Africa vs Immigrants from Eastern Europe Median Male Earnings
COMPARE
Immigrants from Middle Africa
Immigrants from Eastern Europe
Median Male Earnings
Median Male Earnings Comparison
Immigrants from Middle Africa
Immigrants from Eastern Europe
$49,201
MEDIAN MALE EARNINGS
0.6/ 100
METRIC RATING
264th/ 347
METRIC RANK
$60,958
MEDIAN MALE EARNINGS
99.8/ 100
METRIC RATING
64th/ 347
METRIC RANK
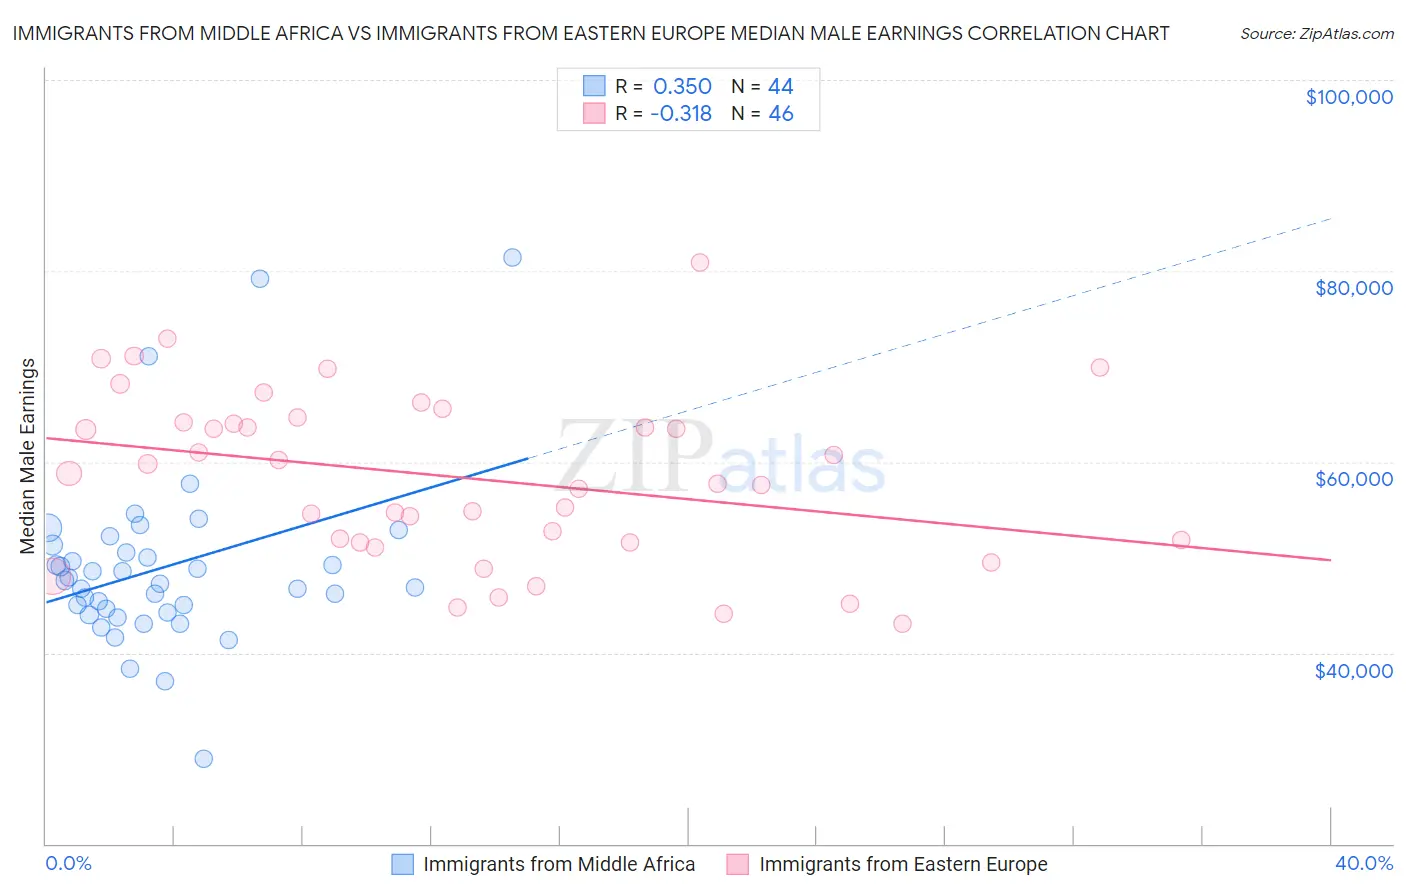
Immigrants from Middle Africa vs Immigrants from Eastern Europe Median Male Earnings Correlation Chart
The statistical analysis conducted on geographies consisting of 202,728,043 people shows a mild positive correlation between the proportion of Immigrants from Middle Africa and median male earnings in the United States with a correlation coefficient (R) of 0.350 and weighted average of $49,201. Similarly, the statistical analysis conducted on geographies consisting of 475,591,188 people shows a mild negative correlation between the proportion of Immigrants from Eastern Europe and median male earnings in the United States with a correlation coefficient (R) of -0.318 and weighted average of $60,958, a difference of 23.9%.
Median Male Earnings Correlation Summary
| Measurement | Immigrants from Middle Africa | Immigrants from Eastern Europe |
| Minimum | $28,882 | $43,003 |
| Maximum | $81,458 | $80,938 |
| Range | $52,576 | $37,935 |
| Mean | $48,940 | $58,399 |
| Median | $47,419 | $58,206 |
| Interquartile 25% (IQ1) | $44,462 | $51,611 |
| Interquartile 75% (IQ3) | $50,890 | $64,157 |
| Interquartile Range (IQR) | $6,428 | $12,547 |
| Standard Deviation (Sample) | $9,309 | $8,866 |
| Standard Deviation (Population) | $9,202 | $8,769 |
Similar Demographics by Median Male Earnings
Demographics Similar to Immigrants from Middle Africa by Median Male Earnings
In terms of median male earnings, the demographic groups most similar to Immigrants from Middle Africa are Immigrants from Laos ($49,190, a difference of 0.020%), Nicaraguan ($49,215, a difference of 0.030%), Immigrants from West Indies ($49,271, a difference of 0.14%), Liberian ($49,318, a difference of 0.24%), and Iroquois ($49,374, a difference of 0.35%).
| Demographics | Rating | Rank | Median Male Earnings |
| British West Indians | 0.8 /100 | #257 | Tragic $49,636 |
| Cree | 0.7 /100 | #258 | Tragic $49,497 |
| Nepalese | 0.7 /100 | #259 | Tragic $49,458 |
| Iroquois | 0.7 /100 | #260 | Tragic $49,374 |
| Liberians | 0.6 /100 | #261 | Tragic $49,318 |
| Immigrants | West Indies | 0.6 /100 | #262 | Tragic $49,271 |
| Nicaraguans | 0.6 /100 | #263 | Tragic $49,215 |
| Immigrants | Middle Africa | 0.6 /100 | #264 | Tragic $49,201 |
| Immigrants | Laos | 0.6 /100 | #265 | Tragic $49,190 |
| Somalis | 0.5 /100 | #266 | Tragic $49,025 |
| Spanish Americans | 0.5 /100 | #267 | Tragic $49,008 |
| Ute | 0.4 /100 | #268 | Tragic $48,899 |
| Tsimshian | 0.4 /100 | #269 | Tragic $48,836 |
| Potawatomi | 0.4 /100 | #270 | Tragic $48,768 |
| Cherokee | 0.3 /100 | #271 | Tragic $48,669 |
Demographics Similar to Immigrants from Eastern Europe by Median Male Earnings
In terms of median male earnings, the demographic groups most similar to Immigrants from Eastern Europe are Immigrants from Indonesia ($60,935, a difference of 0.040%), Immigrants from Pakistan ($60,987, a difference of 0.050%), Immigrants from Croatia ($60,914, a difference of 0.070%), Immigrants from Romania ($61,040, a difference of 0.13%), and Bolivian ($61,066, a difference of 0.18%).
| Demographics | Rating | Rank | Median Male Earnings |
| Immigrants | Scotland | 99.9 /100 | #57 | Exceptional $61,220 |
| New Zealanders | 99.9 /100 | #58 | Exceptional $61,199 |
| Immigrants | Netherlands | 99.8 /100 | #59 | Exceptional $61,096 |
| Egyptians | 99.8 /100 | #60 | Exceptional $61,095 |
| Bolivians | 99.8 /100 | #61 | Exceptional $61,066 |
| Immigrants | Romania | 99.8 /100 | #62 | Exceptional $61,040 |
| Immigrants | Pakistan | 99.8 /100 | #63 | Exceptional $60,987 |
| Immigrants | Eastern Europe | 99.8 /100 | #64 | Exceptional $60,958 |
| Immigrants | Indonesia | 99.8 /100 | #65 | Exceptional $60,935 |
| Immigrants | Croatia | 99.8 /100 | #66 | Exceptional $60,914 |
| Immigrants | Spain | 99.8 /100 | #67 | Exceptional $60,750 |
| Immigrants | Serbia | 99.7 /100 | #68 | Exceptional $60,600 |
| Immigrants | Canada | 99.7 /100 | #69 | Exceptional $60,388 |
| Immigrants | Bulgaria | 99.7 /100 | #70 | Exceptional $60,358 |
| Mongolians | 99.7 /100 | #71 | Exceptional $60,350 |