Immigrants from Latvia vs Immigrants from Honduras Median Earnings
COMPARE
Immigrants from Latvia
Immigrants from Honduras
Median Earnings
Median Earnings Comparison
Immigrants from Latvia
Immigrants from Honduras
$51,555
MEDIAN EARNINGS
99.9/ 100
METRIC RATING
61st/ 347
METRIC RANK
$40,195
MEDIAN EARNINGS
0.0/ 100
METRIC RATING
316th/ 347
METRIC RANK
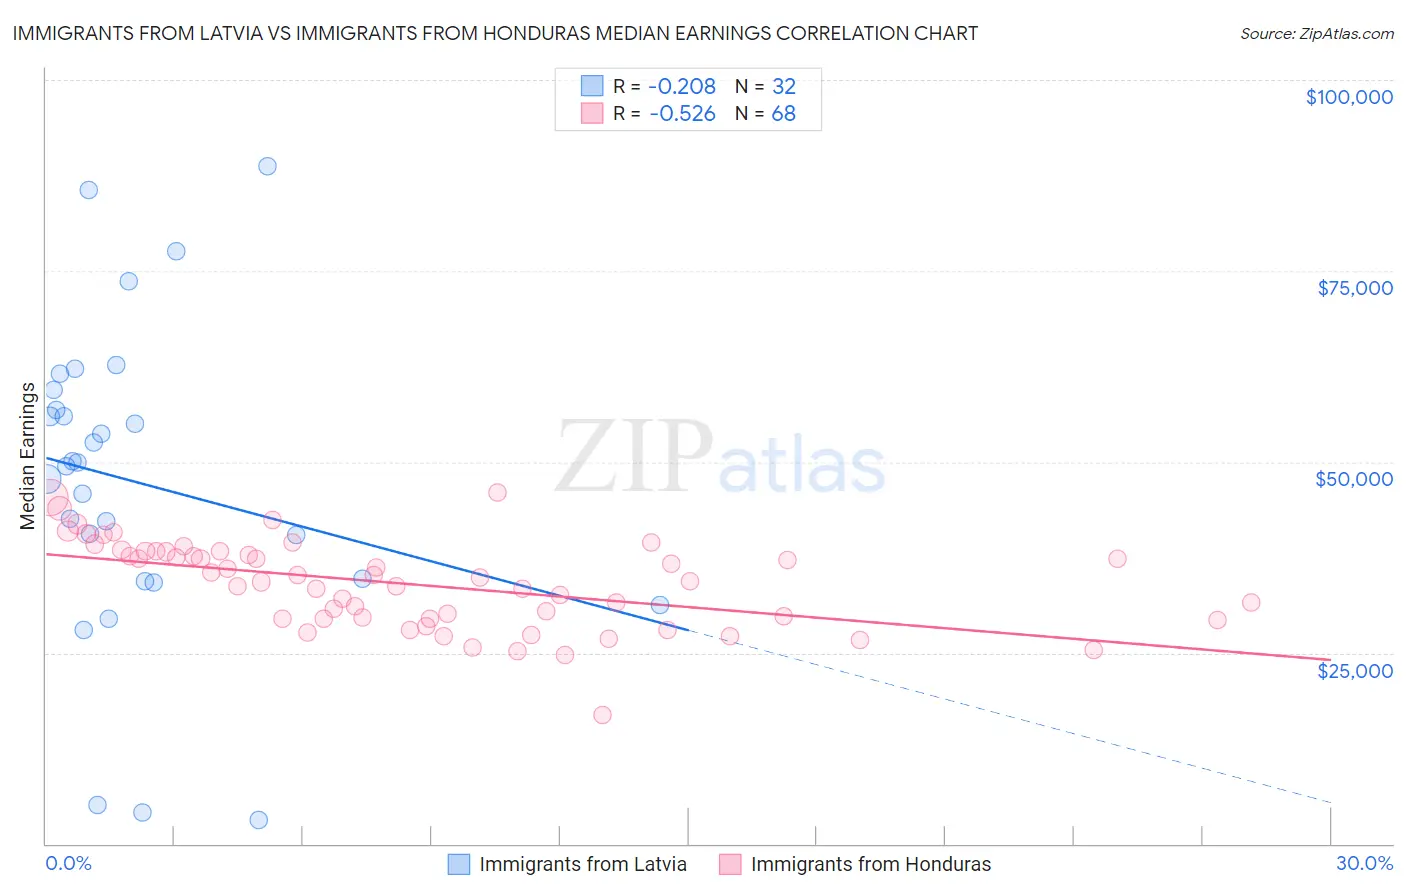
Immigrants from Latvia vs Immigrants from Honduras Median Earnings Correlation Chart
The statistical analysis conducted on geographies consisting of 113,739,608 people shows a weak negative correlation between the proportion of Immigrants from Latvia and median earnings in the United States with a correlation coefficient (R) of -0.208 and weighted average of $51,555. Similarly, the statistical analysis conducted on geographies consisting of 322,602,999 people shows a substantial negative correlation between the proportion of Immigrants from Honduras and median earnings in the United States with a correlation coefficient (R) of -0.526 and weighted average of $40,195, a difference of 28.3%.
Median Earnings Correlation Summary
| Measurement | Immigrants from Latvia | Immigrants from Honduras |
| Minimum | $3,188 | $16,824 |
| Maximum | $88,678 | $45,968 |
| Range | $85,490 | $29,144 |
| Mean | $47,322 | $34,003 |
| Median | $49,671 | $34,587 |
| Interquartile 25% (IQ1) | $34,454 | $29,475 |
| Interquartile 75% (IQ3) | $58,094 | $38,232 |
| Interquartile Range (IQR) | $23,640 | $8,757 |
| Standard Deviation (Sample) | $20,618 | $5,716 |
| Standard Deviation (Population) | $20,294 | $5,674 |
Similar Demographics by Median Earnings
Demographics Similar to Immigrants from Latvia by Median Earnings
In terms of median earnings, the demographic groups most similar to Immigrants from Latvia are Immigrants from Serbia ($51,557, a difference of 0.0%), Immigrants from Croatia ($51,581, a difference of 0.050%), Immigrants from Bolivia ($51,605, a difference of 0.10%), Immigrants from Eastern Europe ($51,624, a difference of 0.13%), and Immigrants from Pakistan ($51,693, a difference of 0.27%).
| Demographics | Rating | Rank | Median Earnings |
| Immigrants | Indonesia | 99.9 /100 | #54 | Exceptional $51,715 |
| Egyptians | 99.9 /100 | #55 | Exceptional $51,701 |
| Immigrants | Pakistan | 99.9 /100 | #56 | Exceptional $51,693 |
| Immigrants | Eastern Europe | 99.9 /100 | #57 | Exceptional $51,624 |
| Immigrants | Bolivia | 99.9 /100 | #58 | Exceptional $51,605 |
| Immigrants | Croatia | 99.9 /100 | #59 | Exceptional $51,581 |
| Immigrants | Serbia | 99.9 /100 | #60 | Exceptional $51,557 |
| Immigrants | Latvia | 99.9 /100 | #61 | Exceptional $51,555 |
| Immigrants | Romania | 99.9 /100 | #62 | Exceptional $51,337 |
| Immigrants | Bulgaria | 99.9 /100 | #63 | Exceptional $51,318 |
| New Zealanders | 99.9 /100 | #64 | Exceptional $51,246 |
| Greeks | 99.9 /100 | #65 | Exceptional $51,164 |
| Afghans | 99.9 /100 | #66 | Exceptional $51,112 |
| Immigrants | Spain | 99.9 /100 | #67 | Exceptional $51,092 |
| Paraguayans | 99.9 /100 | #68 | Exceptional $51,068 |
Demographics Similar to Immigrants from Honduras by Median Earnings
In terms of median earnings, the demographic groups most similar to Immigrants from Honduras are Fijian ($40,193, a difference of 0.0%), Seminole ($40,233, a difference of 0.090%), Cheyenne ($40,233, a difference of 0.10%), Choctaw ($40,270, a difference of 0.19%), and Dutch West Indian ($40,107, a difference of 0.22%).
| Demographics | Rating | Rank | Median Earnings |
| Immigrants | Haiti | 0.0 /100 | #309 | Tragic $40,550 |
| Apache | 0.0 /100 | #310 | Tragic $40,388 |
| Hispanics or Latinos | 0.0 /100 | #311 | Tragic $40,288 |
| Chippewa | 0.0 /100 | #312 | Tragic $40,287 |
| Choctaw | 0.0 /100 | #313 | Tragic $40,270 |
| Cheyenne | 0.0 /100 | #314 | Tragic $40,233 |
| Seminole | 0.0 /100 | #315 | Tragic $40,233 |
| Immigrants | Honduras | 0.0 /100 | #316 | Tragic $40,195 |
| Fijians | 0.0 /100 | #317 | Tragic $40,193 |
| Dutch West Indians | 0.0 /100 | #318 | Tragic $40,107 |
| Blacks/African Americans | 0.0 /100 | #319 | Tragic $40,085 |
| Immigrants | Bahamas | 0.0 /100 | #320 | Tragic $39,861 |
| Mexicans | 0.0 /100 | #321 | Tragic $39,834 |
| Immigrants | Central America | 0.0 /100 | #322 | Tragic $39,762 |
| Bahamians | 0.0 /100 | #323 | Tragic $39,735 |