Slovak vs Immigrants from Honduras Median Earnings

COMPARE

Slovak
Race
Ancestry
AfghanAfricanAlaska NativeAlaskan AthabascanAlbanianAleutAlsatianAmericanApacheArabArapahoArgentineanArmenianAssyrian/Chaldean/SyriacAustralianAustrianBahamianBangladeshiBarbadianBasqueBelgianBelizeanBermudanBhutaneseBlackfeetBolivianBrazilianBritishBritish West IndianBulgarianBurmeseCajunCambodianCanadianCape VerdeanCarpatho RusynCelticCentral AmericanCentral American IndianCherokeeCheyenneChickasawChileanChineseChippewaChoctawColombianColvilleComancheCosta RicanCreeCreekCroatianCrowCubanCypriotCzechCzechoslovakianDanishDelawareDominicanDutchDutch West IndianEastern EuropeanEcuadorianEgyptianEnglishEstonianEthiopianEuropeanFijianFilipinoFinnishFrenchFrench American IndianFrench CanadianGermanGerman RussianGhanaianGreekGuamanian/ChamorroGuatemalanGuyaneseHaitianHmongHonduranHopiHoumaHungarianIcelanderIndian (Asian)IndonesianInupiatIranianIraqiIrishIroquoisIsraeliItalianJamaicanJapaneseJordanianKenyanKiowaKoreanLaotianLatvianLebaneseLiberianLithuanianLumbeeLuxembourgerMacedonianMalaysianMalteseMarshalleseMenomineeMexicanMexican American IndianMongolianMoroccanNative HawaiianNavajoNepaleseNew ZealanderNicaraguanNigerianNorthern EuropeanNorwegianOkinawanOsageOttawaPaiutePakistaniPalestinianPanamanianParaguayanPennsylvania GermanPeruvianPimaPolishPortuguesePotawatomiPuebloPuerto RicanPuget Sound SalishRomanianRussianSalvadoranSamoanScandinavianScotch-IrishScottishSeminoleSenegaleseSerbianShoshoneSierra LeoneanSiouxSlavicSlovakSloveneSomaliSouth AfricanSouth AmericanSouth American IndianSoviet UnionSpaniardSpanishSpanish AmericanSpanish American IndianSri LankanSubsaharan AfricanSudaneseSwedishSwissSyrianTaiwaneseThaiTlingit-HaidaTohono O'OdhamTonganTrinidadian and TobagonianTsimshianTurkishU.S. Virgin IslanderUgandanUkrainianUruguayanUteVenezuelanVietnameseWelshWest IndianYakamaYaquiYugoslavianYumanYup'ikZimbabwean
Immigration
NonimmigrantsImmigrantsAfghanistanAfricaAlbaniaArgentinaArmeniaAsiaAustraliaAustriaBahamasBangladeshBarbadosBelarusBelgiumBelizeBoliviaBosnia and HerzegovinaBrazilBulgariaBurma/MyanmarCabo VerdeCambodiaCameroonCanadaCaribbeanCentral AmericaChileChinaColombiaCongoCosta RicaCroatiaCubaCzechoslovakiaDenmarkDominicaDominican RepublicEastern AfricaEastern AsiaEastern EuropeEcuadorEgyptEl SalvadorEnglandEritreaEthiopiaEuropeFijiFranceGermanyGhanaGreeceGrenadaGuatemalaGuyanaHaitiHong KongHungaryIndiaIndonesiaIranIraqIrelandIsraelItalyJamaicaJapanJordanKazakhstanKenyaKoreaKuwaitLaosLatin AmericaLatviaLebanonLiberiaLithuaniaMalaysiaMexicoMicronesiaMiddle AfricaMoldovaMoroccoNepalNetherlandsNicaraguaNigeriaNorth AmericaNorth MacedoniaNorthern AfricaNorthern EuropeNorwayOceaniaPakistanPanamaPeruPhilippinesPolandPortugalRomaniaRussiaSaudi ArabiaScotlandSenegalSerbiaSierra LeoneSingaporeSomaliaSouth AfricaSouth AmericaSouth Central AsiaSouth Eastern AsiaSouthern EuropeSpainSri LankaSt. Vincent and the GrenadinesSudanSwedenSwitzerlandSyriaTaiwanThailandTrinidad and TobagoTurkeyUgandaUkraineUruguayUzbekistanVenezuelaVietnamWest IndiesWestern AfricaWestern AsiaWestern EuropeYemenZaireZimbabweAzores
Immigrants from Honduras
Race
Ancestry
AfghanAfricanAlaska NativeAlaskan AthabascanAlbanianAleutAlsatianAmericanApacheArabArapahoArgentineanArmenianAssyrian/Chaldean/SyriacAustralianAustrianBahamianBangladeshiBarbadianBasqueBelgianBelizeanBermudanBhutaneseBlackfeetBolivianBrazilianBritishBritish West IndianBulgarianBurmeseCajunCambodianCanadianCape VerdeanCarpatho RusynCelticCentral AmericanCentral American IndianCherokeeCheyenneChickasawChileanChineseChippewaChoctawColombianColvilleComancheCosta RicanCreeCreekCroatianCrowCubanCypriotCzechCzechoslovakianDanishDelawareDominicanDutchDutch West IndianEastern EuropeanEcuadorianEgyptianEnglishEstonianEthiopianEuropeanFijianFilipinoFinnishFrenchFrench American IndianFrench CanadianGermanGerman RussianGhanaianGreekGuamanian/ChamorroGuatemalanGuyaneseHaitianHmongHonduranHopiHoumaHungarianIcelanderIndian (Asian)IndonesianInupiatIranianIraqiIrishIroquoisIsraeliItalianJamaicanJapaneseJordanianKenyanKiowaKoreanLaotianLatvianLebaneseLiberianLithuanianLumbeeLuxembourgerMacedonianMalaysianMalteseMarshalleseMenomineeMexicanMexican American IndianMongolianMoroccanNative HawaiianNavajoNepaleseNew ZealanderNicaraguanNigerianNorthern EuropeanNorwegianOkinawanOsageOttawaPaiutePakistaniPalestinianPanamanianParaguayanPennsylvania GermanPeruvianPimaPolishPortuguesePotawatomiPuebloPuerto RicanPuget Sound SalishRomanianRussianSalvadoranSamoanScandinavianScotch-IrishScottishSeminoleSenegaleseSerbianShoshoneSierra LeoneanSiouxSlavicSloveneSomaliSouth AfricanSouth AmericanSouth American IndianSoviet UnionSpaniardSpanishSpanish AmericanSpanish American IndianSri LankanSubsaharan AfricanSudaneseSwedishSwissSyrianTaiwaneseThaiTlingit-HaidaTohono O'OdhamTonganTrinidadian and TobagonianTsimshianTurkishU.S. Virgin IslanderUgandanUkrainianUruguayanUteVenezuelanVietnameseWelshWest IndianYakamaYaquiYugoslavianYumanYup'ikZimbabwean
Immigration
NonimmigrantsImmigrantsAfghanistanAfricaAlbaniaArgentinaArmeniaAsiaAustraliaAustriaBahamasBangladeshBarbadosBelarusBelgiumBelizeBoliviaBosnia and HerzegovinaBrazilBulgariaBurma/MyanmarCabo VerdeCambodiaCameroonCanadaCaribbeanCentral AmericaChileChinaColombiaCongoCosta RicaCroatiaCubaCzechoslovakiaDenmarkDominicaDominican RepublicEastern AfricaEastern AsiaEastern EuropeEcuadorEgyptEl SalvadorEnglandEritreaEthiopiaEuropeFijiFranceGermanyGhanaGreeceGrenadaGuatemalaGuyanaHaitiHondurasHong KongHungaryIndiaIndonesiaIranIraqIrelandIsraelItalyJamaicaJapanJordanKazakhstanKenyaKoreaKuwaitLaosLatin AmericaLatviaLebanonLiberiaLithuaniaMalaysiaMexicoMicronesiaMiddle AfricaMoldovaMoroccoNepalNetherlandsNicaraguaNigeriaNorth AmericaNorth MacedoniaNorthern AfricaNorthern EuropeNorwayOceaniaPakistanPanamaPeruPhilippinesPolandPortugalRomaniaRussiaSaudi ArabiaScotlandSenegalSerbiaSierra LeoneSingaporeSomaliaSouth AfricaSouth AmericaSouth Central AsiaSouth Eastern AsiaSouthern EuropeSpainSri LankaSt. Vincent and the GrenadinesSudanSwedenSwitzerlandSyriaTaiwanThailandTrinidad and TobagoTurkeyUgandaUkraineUruguayUzbekistanVenezuelaVietnamWest IndiesWestern AfricaWestern AsiaWestern EuropeYemenZaireZimbabweAzores
Median Earnings
Income
Poverty
Unemployment
Labor Participation
Family Structure
Vehicle Availability
Education Level
Disability

Median Earnings Comparison

Slovaks

Immigrants from Honduras

Good
Tragic
$47,095
MEDIAN EARNINGS
71.7/ 100
METRIC RATING
158th/ 347
METRIC RANK
$40,195
MEDIAN EARNINGS
0.0/ 100
METRIC RATING
316th/ 347
METRIC RANK

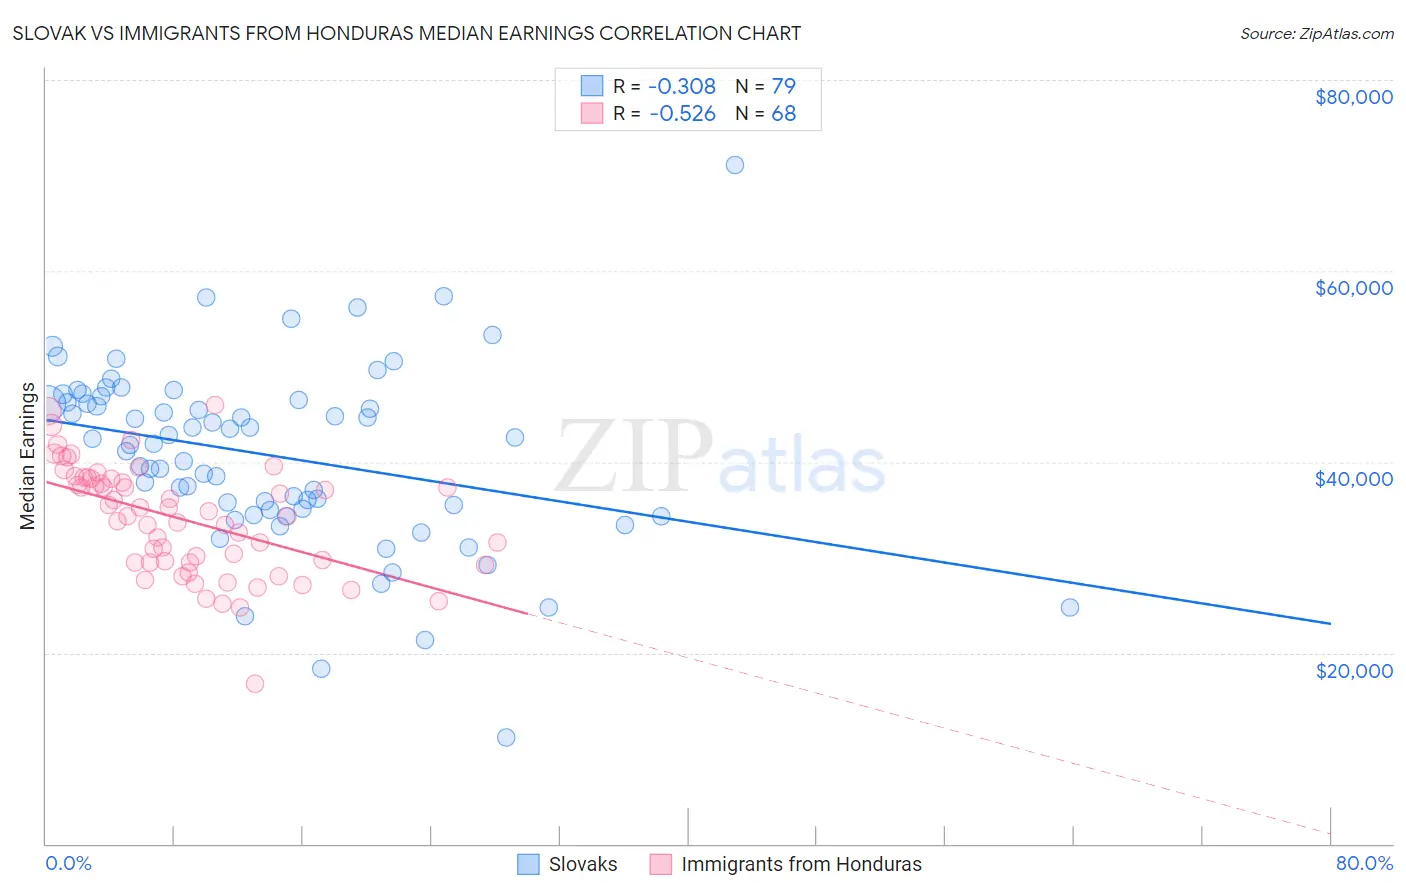
Slovak vs Immigrants from Honduras Median Earnings Correlation Chart

The statistical analysis conducted on geographies consisting of 397,848,187 people shows a mild negative correlation between the proportion of Slovaks and median earnings in the United States with a correlation coefficient (R) of -0.308 and weighted average of $47,095. Similarly, the statistical analysis conducted on geographies consisting of 322,602,999 people shows a substantial negative correlation between the proportion of Immigrants from Honduras and median earnings in the United States with a correlation coefficient (R) of -0.526 and weighted average of $40,195, a difference of 17.2%.
Slovak vs Immigrants from Honduras Median Earnings

Median Earnings Correlation Summary

MeasurementSlovakImmigrants from Honduras
Minimum$11,076$16,824
Maximum$71,150$45,968
Range$60,074$29,144
Mean$40,661$34,003
Median$41,901$34,587
Interquartile 25% (IQ1)$35,020$29,475
Interquartile 75% (IQ3)$46,429$38,232
Interquartile Range (IQR)$11,409$8,757
Standard Deviation (Sample)$9,606$5,716
Standard Deviation (Population)$9,545$5,674

Similar Demographics by Median Earnings

Demographics Similar to Slovaks by Median Earnings

In terms of median earnings, the demographic groups most similar to Slovaks are Immigrants from Peru ($47,025, a difference of 0.15%), Alsatian ($47,023, a difference of 0.15%), Czech ($47,221, a difference of 0.27%), Immigrants from Eastern Africa ($46,969, a difference of 0.27%), and South American Indian ($46,952, a difference of 0.31%).
DemographicsRating | RankMedian Earnings
Immigrants | Oceania
84.1
/100
|
#151
Excellent
$47,617
Immigrants | Germany
83.1
/100
|
#152
Excellent
$47,566
Slavs
81.1
/100
|
#153
Excellent
$47,470
Immigrants | Portugal
77.3
/100
|
#154
Good
$47,304
Immigrants | Vietnam
76.7
/100
|
#155
Good
$47,282
Irish
76.6
/100
|
#156
Good
$47,276
Czechs
75.1
/100
|
#157
Good
$47,221
Slovaks
71.7
/100
|
#158
Good
$47,095
Immigrants | Peru
69.6
/100
|
#159
Good
$47,025
Alsatians
69.6
/100
|
#160
Good
$47,023
Immigrants | Eastern Africa
68.0
/100
|
#161
Good
$46,969
South American Indians
67.4
/100
|
#162
Good
$46,952
Icelanders
66.3
/100
|
#163
Good
$46,916
Norwegians
64.7
/100
|
#164
Good
$46,865
South Americans
62.7
/100
|
#165
Good
$46,804

Demographics Similar to Immigrants from Honduras by Median Earnings

In terms of median earnings, the demographic groups most similar to Immigrants from Honduras are Fijian ($40,193, a difference of 0.0%), Seminole ($40,233, a difference of 0.090%), Cheyenne ($40,233, a difference of 0.10%), Choctaw ($40,270, a difference of 0.19%), and Dutch West Indian ($40,107, a difference of 0.22%).
DemographicsRating | RankMedian Earnings
Immigrants | Haiti
0.0
/100
|
#309
Tragic
$40,550
Apache
0.0
/100
|
#310
Tragic
$40,388
Hispanics or Latinos
0.0
/100
|
#311
Tragic
$40,288
Chippewa
0.0
/100
|
#312
Tragic
$40,287
Choctaw
0.0
/100
|
#313
Tragic
$40,270
Cheyenne
0.0
/100
|
#314
Tragic
$40,233
Seminole
0.0
/100
|
#315
Tragic
$40,233
Immigrants | Honduras
0.0
/100
|
#316
Tragic
$40,195
Fijians
0.0
/100
|
#317
Tragic
$40,193
Dutch West Indians
0.0
/100
|
#318
Tragic
$40,107
Blacks/African Americans
0.0
/100
|
#319
Tragic
$40,085
Immigrants | Bahamas
0.0
/100
|
#320
Tragic
$39,861
Mexicans
0.0
/100
|
#321
Tragic
$39,834
Immigrants | Central America
0.0
/100
|
#322
Tragic
$39,762
Bahamians
0.0
/100
|
#323
Tragic
$39,735