Immigrants from Latvia vs Immigrants from Ecuador Median Earnings
COMPARE
Immigrants from Latvia
Immigrants from Ecuador
Median Earnings
Median Earnings Comparison
Immigrants from Latvia
Immigrants from Ecuador
$51,555
MEDIAN EARNINGS
99.9/ 100
METRIC RATING
61st/ 347
METRIC RANK
$44,462
MEDIAN EARNINGS
5.9/ 100
METRIC RATING
237th/ 347
METRIC RANK
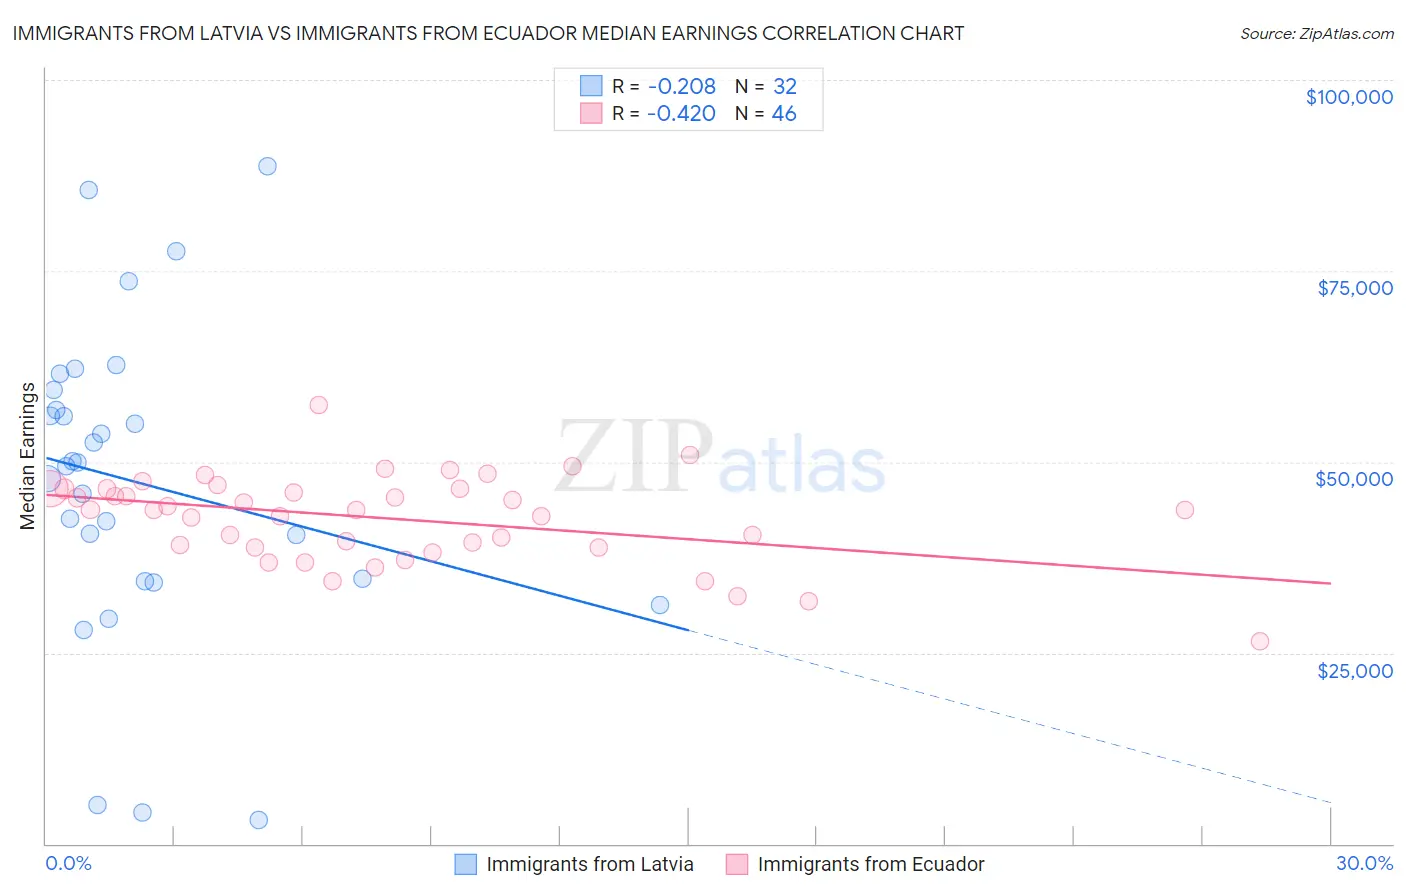
Immigrants from Latvia vs Immigrants from Ecuador Median Earnings Correlation Chart
The statistical analysis conducted on geographies consisting of 113,739,608 people shows a weak negative correlation between the proportion of Immigrants from Latvia and median earnings in the United States with a correlation coefficient (R) of -0.208 and weighted average of $51,555. Similarly, the statistical analysis conducted on geographies consisting of 271,003,938 people shows a moderate negative correlation between the proportion of Immigrants from Ecuador and median earnings in the United States with a correlation coefficient (R) of -0.420 and weighted average of $44,462, a difference of 16.0%.
Median Earnings Correlation Summary
| Measurement | Immigrants from Latvia | Immigrants from Ecuador |
| Minimum | $3,188 | $26,500 |
| Maximum | $88,678 | $57,428 |
| Range | $85,490 | $30,928 |
| Mean | $47,322 | $42,586 |
| Median | $49,671 | $43,711 |
| Interquartile 25% (IQ1) | $34,454 | $38,859 |
| Interquartile 75% (IQ3) | $58,094 | $46,439 |
| Interquartile Range (IQR) | $23,640 | $7,579 |
| Standard Deviation (Sample) | $20,618 | $5,767 |
| Standard Deviation (Population) | $20,294 | $5,704 |
Similar Demographics by Median Earnings
Demographics Similar to Immigrants from Latvia by Median Earnings
In terms of median earnings, the demographic groups most similar to Immigrants from Latvia are Immigrants from Serbia ($51,557, a difference of 0.0%), Immigrants from Croatia ($51,581, a difference of 0.050%), Immigrants from Bolivia ($51,605, a difference of 0.10%), Immigrants from Eastern Europe ($51,624, a difference of 0.13%), and Immigrants from Pakistan ($51,693, a difference of 0.27%).
| Demographics | Rating | Rank | Median Earnings |
| Immigrants | Indonesia | 99.9 /100 | #54 | Exceptional $51,715 |
| Egyptians | 99.9 /100 | #55 | Exceptional $51,701 |
| Immigrants | Pakistan | 99.9 /100 | #56 | Exceptional $51,693 |
| Immigrants | Eastern Europe | 99.9 /100 | #57 | Exceptional $51,624 |
| Immigrants | Bolivia | 99.9 /100 | #58 | Exceptional $51,605 |
| Immigrants | Croatia | 99.9 /100 | #59 | Exceptional $51,581 |
| Immigrants | Serbia | 99.9 /100 | #60 | Exceptional $51,557 |
| Immigrants | Latvia | 99.9 /100 | #61 | Exceptional $51,555 |
| Immigrants | Romania | 99.9 /100 | #62 | Exceptional $51,337 |
| Immigrants | Bulgaria | 99.9 /100 | #63 | Exceptional $51,318 |
| New Zealanders | 99.9 /100 | #64 | Exceptional $51,246 |
| Greeks | 99.9 /100 | #65 | Exceptional $51,164 |
| Afghans | 99.9 /100 | #66 | Exceptional $51,112 |
| Immigrants | Spain | 99.9 /100 | #67 | Exceptional $51,092 |
| Paraguayans | 99.9 /100 | #68 | Exceptional $51,068 |
Demographics Similar to Immigrants from Ecuador by Median Earnings
In terms of median earnings, the demographic groups most similar to Immigrants from Ecuador are Sudanese ($44,419, a difference of 0.10%), British West Indian ($44,552, a difference of 0.20%), Senegalese ($44,373, a difference of 0.20%), Venezuelan ($44,580, a difference of 0.27%), and Cape Verdean ($44,640, a difference of 0.40%).
| Demographics | Rating | Rank | Median Earnings |
| Immigrants | Western Africa | 10.3 /100 | #230 | Poor $44,893 |
| Japanese | 9.5 /100 | #231 | Tragic $44,825 |
| Delaware | 9.0 /100 | #232 | Tragic $44,783 |
| Immigrants | Sudan | 8.8 /100 | #233 | Tragic $44,767 |
| Cape Verdeans | 7.5 /100 | #234 | Tragic $44,640 |
| Venezuelans | 6.9 /100 | #235 | Tragic $44,580 |
| British West Indians | 6.7 /100 | #236 | Tragic $44,552 |
| Immigrants | Ecuador | 5.9 /100 | #237 | Tragic $44,462 |
| Sudanese | 5.6 /100 | #238 | Tragic $44,419 |
| Senegalese | 5.3 /100 | #239 | Tragic $44,373 |
| Aleuts | 4.4 /100 | #240 | Tragic $44,241 |
| Samoans | 4.2 /100 | #241 | Tragic $44,206 |
| Immigrants | Venezuela | 4.0 /100 | #242 | Tragic $44,163 |
| Sub-Saharan Africans | 3.7 /100 | #243 | Tragic $44,118 |
| Immigrants | Nonimmigrants | 3.7 /100 | #244 | Tragic $44,117 |