Bolivian vs Immigrants from Honduras Median Earnings
COMPARE
Bolivian
Immigrants from Honduras
Median Earnings
Median Earnings Comparison
Bolivians
Immigrants from Honduras
$52,005
MEDIAN EARNINGS
100.0/ 100
METRIC RATING
49th/ 347
METRIC RANK
$40,195
MEDIAN EARNINGS
0.0/ 100
METRIC RATING
316th/ 347
METRIC RANK
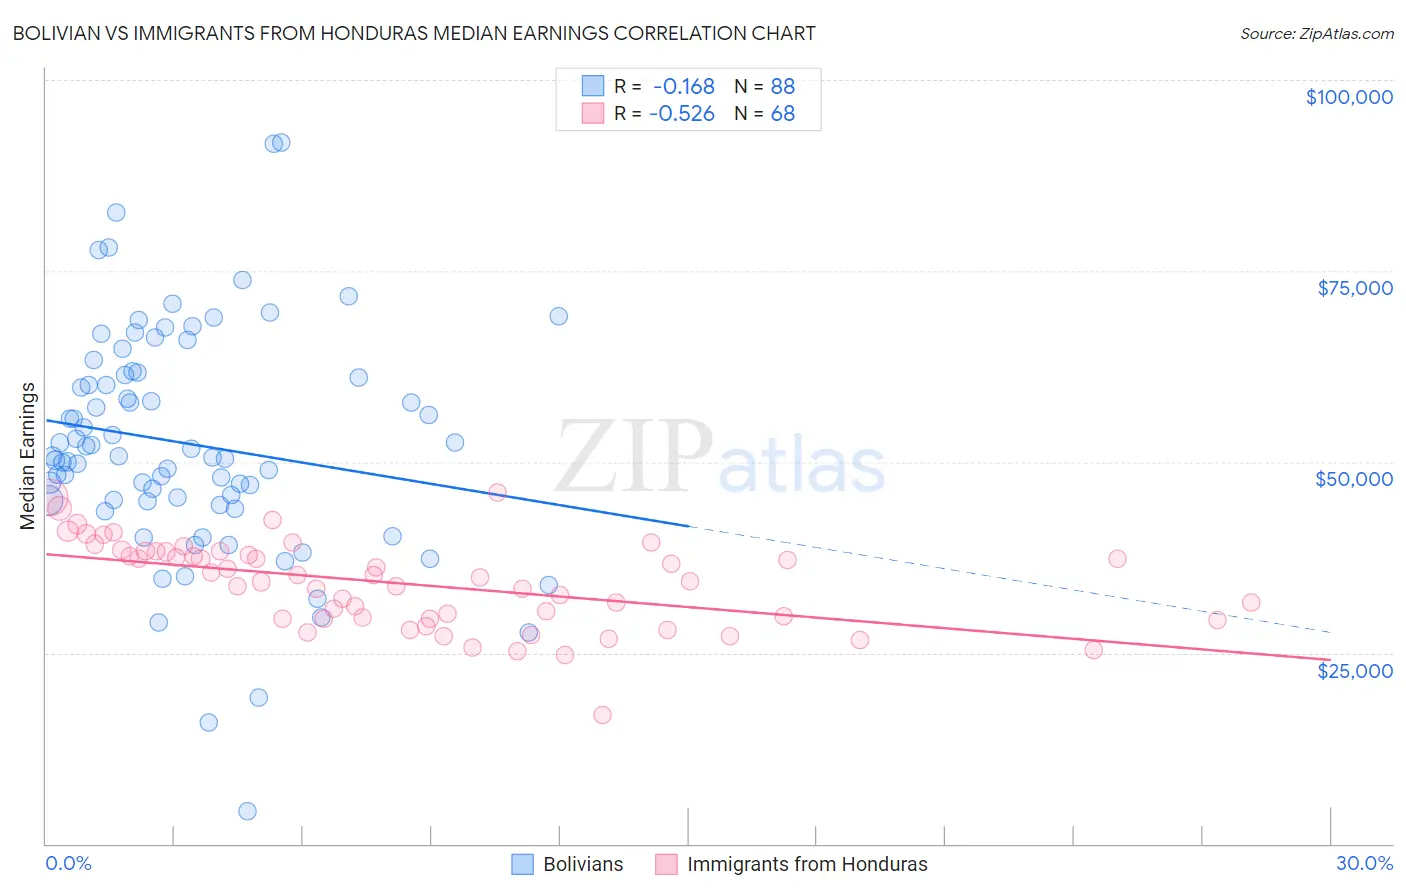
Bolivian vs Immigrants from Honduras Median Earnings Correlation Chart
The statistical analysis conducted on geographies consisting of 184,675,536 people shows a poor negative correlation between the proportion of Bolivians and median earnings in the United States with a correlation coefficient (R) of -0.168 and weighted average of $52,005. Similarly, the statistical analysis conducted on geographies consisting of 322,602,999 people shows a substantial negative correlation between the proportion of Immigrants from Honduras and median earnings in the United States with a correlation coefficient (R) of -0.526 and weighted average of $40,195, a difference of 29.4%.
Median Earnings Correlation Summary
| Measurement | Bolivian | Immigrants from Honduras |
| Minimum | $4,250 | $16,824 |
| Maximum | $91,786 | $45,968 |
| Range | $87,536 | $29,144 |
| Mean | $52,342 | $34,003 |
| Median | $50,729 | $34,587 |
| Interquartile 25% (IQ1) | $44,853 | $29,475 |
| Interquartile 75% (IQ3) | $61,590 | $38,232 |
| Interquartile Range (IQR) | $16,737 | $8,757 |
| Standard Deviation (Sample) | $15,104 | $5,716 |
| Standard Deviation (Population) | $15,018 | $5,674 |
Similar Demographics by Median Earnings
Demographics Similar to Bolivians by Median Earnings
In terms of median earnings, the demographic groups most similar to Bolivians are Immigrants from South Africa ($51,850, a difference of 0.30%), Immigrants from Austria ($51,826, a difference of 0.35%), Immigrants from Europe ($52,195, a difference of 0.37%), Estonian ($51,772, a difference of 0.45%), and Immigrants from Norway ($51,758, a difference of 0.48%).
| Demographics | Rating | Rank | Median Earnings |
| Maltese | 100.0 /100 | #42 | Exceptional $52,526 |
| Immigrants | Malaysia | 100.0 /100 | #43 | Exceptional $52,514 |
| Bulgarians | 100.0 /100 | #44 | Exceptional $52,512 |
| Immigrants | Czechoslovakia | 100.0 /100 | #45 | Exceptional $52,361 |
| Bhutanese | 100.0 /100 | #46 | Exceptional $52,297 |
| Australians | 100.0 /100 | #47 | Exceptional $52,294 |
| Immigrants | Europe | 100.0 /100 | #48 | Exceptional $52,195 |
| Bolivians | 100.0 /100 | #49 | Exceptional $52,005 |
| Immigrants | South Africa | 100.0 /100 | #50 | Exceptional $51,850 |
| Immigrants | Austria | 99.9 /100 | #51 | Exceptional $51,826 |
| Estonians | 99.9 /100 | #52 | Exceptional $51,772 |
| Immigrants | Norway | 99.9 /100 | #53 | Exceptional $51,758 |
| Immigrants | Indonesia | 99.9 /100 | #54 | Exceptional $51,715 |
| Egyptians | 99.9 /100 | #55 | Exceptional $51,701 |
| Immigrants | Pakistan | 99.9 /100 | #56 | Exceptional $51,693 |
Demographics Similar to Immigrants from Honduras by Median Earnings
In terms of median earnings, the demographic groups most similar to Immigrants from Honduras are Fijian ($40,193, a difference of 0.0%), Seminole ($40,233, a difference of 0.090%), Cheyenne ($40,233, a difference of 0.10%), Choctaw ($40,270, a difference of 0.19%), and Dutch West Indian ($40,107, a difference of 0.22%).
| Demographics | Rating | Rank | Median Earnings |
| Immigrants | Haiti | 0.0 /100 | #309 | Tragic $40,550 |
| Apache | 0.0 /100 | #310 | Tragic $40,388 |
| Hispanics or Latinos | 0.0 /100 | #311 | Tragic $40,288 |
| Chippewa | 0.0 /100 | #312 | Tragic $40,287 |
| Choctaw | 0.0 /100 | #313 | Tragic $40,270 |
| Cheyenne | 0.0 /100 | #314 | Tragic $40,233 |
| Seminole | 0.0 /100 | #315 | Tragic $40,233 |
| Immigrants | Honduras | 0.0 /100 | #316 | Tragic $40,195 |
| Fijians | 0.0 /100 | #317 | Tragic $40,193 |
| Dutch West Indians | 0.0 /100 | #318 | Tragic $40,107 |
| Blacks/African Americans | 0.0 /100 | #319 | Tragic $40,085 |
| Immigrants | Bahamas | 0.0 /100 | #320 | Tragic $39,861 |
| Mexicans | 0.0 /100 | #321 | Tragic $39,834 |
| Immigrants | Central America | 0.0 /100 | #322 | Tragic $39,762 |
| Bahamians | 0.0 /100 | #323 | Tragic $39,735 |