Immigrants from Latvia vs Norwegian Median Earnings
COMPARE
Immigrants from Latvia
Norwegian
Median Earnings
Median Earnings Comparison
Immigrants from Latvia
Norwegians
$51,555
MEDIAN EARNINGS
99.9/ 100
METRIC RATING
61st/ 347
METRIC RANK
$46,865
MEDIAN EARNINGS
64.7/ 100
METRIC RATING
164th/ 347
METRIC RANK
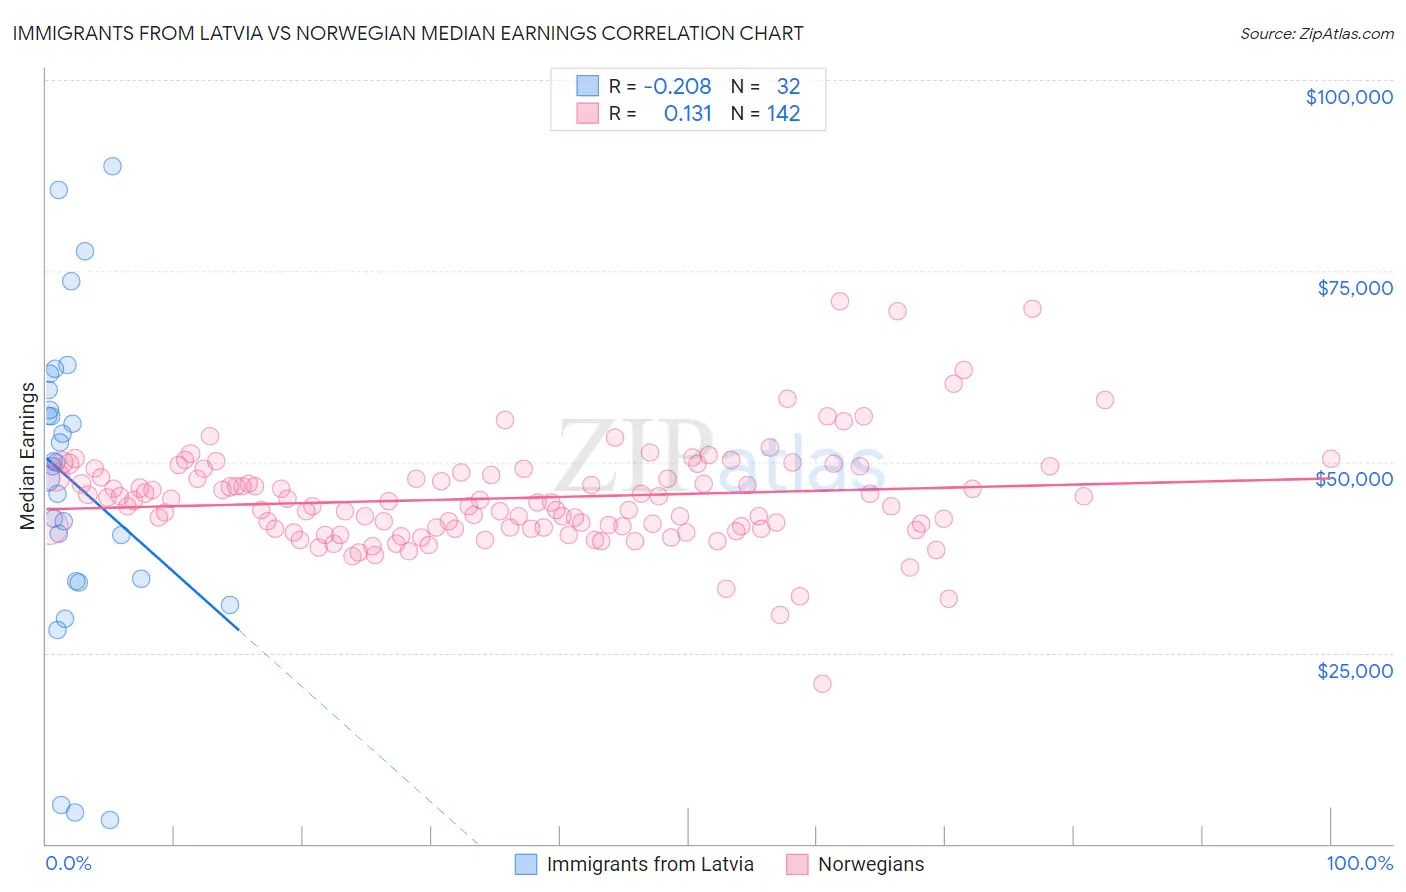
Immigrants from Latvia vs Norwegian Median Earnings Correlation Chart
The statistical analysis conducted on geographies consisting of 113,739,608 people shows a weak negative correlation between the proportion of Immigrants from Latvia and median earnings in the United States with a correlation coefficient (R) of -0.208 and weighted average of $51,555. Similarly, the statistical analysis conducted on geographies consisting of 533,161,956 people shows a poor positive correlation between the proportion of Norwegians and median earnings in the United States with a correlation coefficient (R) of 0.131 and weighted average of $46,865, a difference of 10.0%.
Median Earnings Correlation Summary
| Measurement | Immigrants from Latvia | Norwegian |
| Minimum | $3,188 | $21,029 |
| Maximum | $88,678 | $70,965 |
| Range | $85,490 | $49,936 |
| Mean | $47,322 | $45,261 |
| Median | $49,671 | $44,720 |
| Interquartile 25% (IQ1) | $34,454 | $41,272 |
| Interquartile 75% (IQ3) | $58,094 | $48,283 |
| Interquartile Range (IQR) | $23,640 | $7,011 |
| Standard Deviation (Sample) | $20,618 | $6,752 |
| Standard Deviation (Population) | $20,294 | $6,728 |
Similar Demographics by Median Earnings
Demographics Similar to Immigrants from Latvia by Median Earnings
In terms of median earnings, the demographic groups most similar to Immigrants from Latvia are Immigrants from Serbia ($51,557, a difference of 0.0%), Immigrants from Croatia ($51,581, a difference of 0.050%), Immigrants from Bolivia ($51,605, a difference of 0.10%), Immigrants from Eastern Europe ($51,624, a difference of 0.13%), and Immigrants from Pakistan ($51,693, a difference of 0.27%).
| Demographics | Rating | Rank | Median Earnings |
| Immigrants | Indonesia | 99.9 /100 | #54 | Exceptional $51,715 |
| Egyptians | 99.9 /100 | #55 | Exceptional $51,701 |
| Immigrants | Pakistan | 99.9 /100 | #56 | Exceptional $51,693 |
| Immigrants | Eastern Europe | 99.9 /100 | #57 | Exceptional $51,624 |
| Immigrants | Bolivia | 99.9 /100 | #58 | Exceptional $51,605 |
| Immigrants | Croatia | 99.9 /100 | #59 | Exceptional $51,581 |
| Immigrants | Serbia | 99.9 /100 | #60 | Exceptional $51,557 |
| Immigrants | Latvia | 99.9 /100 | #61 | Exceptional $51,555 |
| Immigrants | Romania | 99.9 /100 | #62 | Exceptional $51,337 |
| Immigrants | Bulgaria | 99.9 /100 | #63 | Exceptional $51,318 |
| New Zealanders | 99.9 /100 | #64 | Exceptional $51,246 |
| Greeks | 99.9 /100 | #65 | Exceptional $51,164 |
| Afghans | 99.9 /100 | #66 | Exceptional $51,112 |
| Immigrants | Spain | 99.9 /100 | #67 | Exceptional $51,092 |
| Paraguayans | 99.9 /100 | #68 | Exceptional $51,068 |
Demographics Similar to Norwegians by Median Earnings
In terms of median earnings, the demographic groups most similar to Norwegians are Icelander ($46,916, a difference of 0.11%), South American ($46,804, a difference of 0.13%), South American Indian ($46,952, a difference of 0.18%), Immigrants from Eastern Africa ($46,969, a difference of 0.22%), and Immigrants from Peru ($47,025, a difference of 0.34%).
| Demographics | Rating | Rank | Median Earnings |
| Czechs | 75.1 /100 | #157 | Good $47,221 |
| Slovaks | 71.7 /100 | #158 | Good $47,095 |
| Immigrants | Peru | 69.6 /100 | #159 | Good $47,025 |
| Alsatians | 69.6 /100 | #160 | Good $47,023 |
| Immigrants | Eastern Africa | 68.0 /100 | #161 | Good $46,969 |
| South American Indians | 67.4 /100 | #162 | Good $46,952 |
| Icelanders | 66.3 /100 | #163 | Good $46,916 |
| Norwegians | 64.7 /100 | #164 | Good $46,865 |
| South Americans | 62.7 /100 | #165 | Good $46,804 |
| Czechoslovakians | 57.8 /100 | #166 | Average $46,658 |
| Costa Ricans | 57.4 /100 | #167 | Average $46,645 |
| Immigrants | Africa | 54.6 /100 | #168 | Average $46,564 |
| Immigrants | South America | 54.0 /100 | #169 | Average $46,548 |
| Immigrants | Immigrants | 51.6 /100 | #170 | Average $46,478 |
| Scottish | 51.1 /100 | #171 | Average $46,463 |