Immigrants from Latvia vs Kenyan Median Earnings
COMPARE
Immigrants from Latvia
Kenyan
Median Earnings
Median Earnings Comparison
Immigrants from Latvia
Kenyans
$51,555
MEDIAN EARNINGS
99.9/ 100
METRIC RATING
61st/ 347
METRIC RANK
$46,462
MEDIAN EARNINGS
51.0/ 100
METRIC RATING
172nd/ 347
METRIC RANK
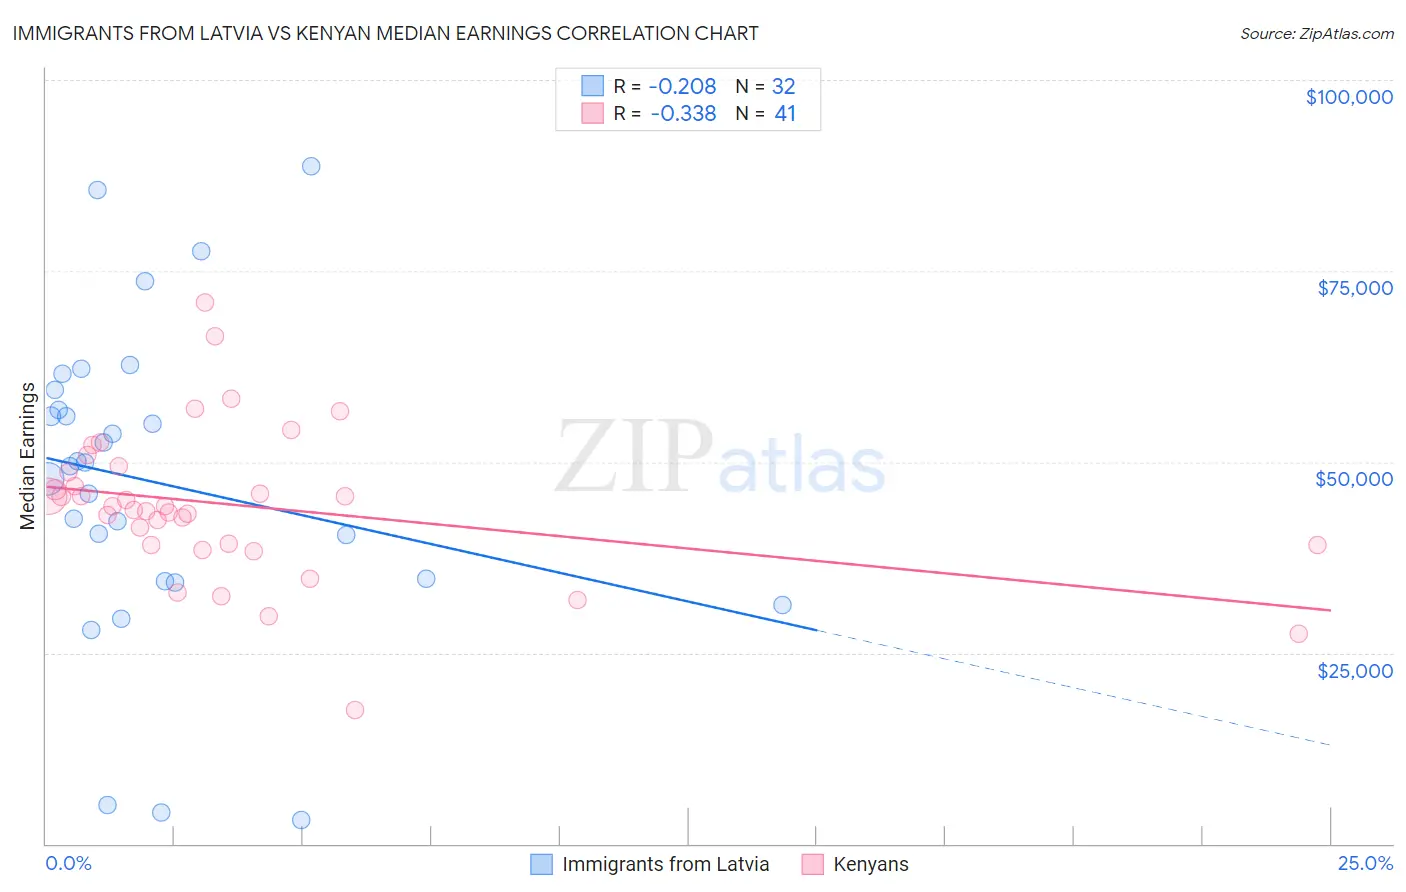
Immigrants from Latvia vs Kenyan Median Earnings Correlation Chart
The statistical analysis conducted on geographies consisting of 113,739,608 people shows a weak negative correlation between the proportion of Immigrants from Latvia and median earnings in the United States with a correlation coefficient (R) of -0.208 and weighted average of $51,555. Similarly, the statistical analysis conducted on geographies consisting of 168,231,616 people shows a mild negative correlation between the proportion of Kenyans and median earnings in the United States with a correlation coefficient (R) of -0.338 and weighted average of $46,462, a difference of 11.0%.
Median Earnings Correlation Summary
| Measurement | Immigrants from Latvia | Kenyan |
| Minimum | $3,188 | $17,500 |
| Maximum | $88,678 | $70,848 |
| Range | $85,490 | $53,348 |
| Mean | $47,322 | $44,292 |
| Median | $49,671 | $44,246 |
| Interquartile 25% (IQ1) | $34,454 | $39,165 |
| Interquartile 75% (IQ3) | $58,094 | $49,031 |
| Interquartile Range (IQR) | $23,640 | $9,866 |
| Standard Deviation (Sample) | $20,618 | $9,917 |
| Standard Deviation (Population) | $20,294 | $9,795 |
Similar Demographics by Median Earnings
Demographics Similar to Immigrants from Latvia by Median Earnings
In terms of median earnings, the demographic groups most similar to Immigrants from Latvia are Immigrants from Serbia ($51,557, a difference of 0.0%), Immigrants from Croatia ($51,581, a difference of 0.050%), Immigrants from Bolivia ($51,605, a difference of 0.10%), Immigrants from Eastern Europe ($51,624, a difference of 0.13%), and Immigrants from Pakistan ($51,693, a difference of 0.27%).
| Demographics | Rating | Rank | Median Earnings |
| Immigrants | Indonesia | 99.9 /100 | #54 | Exceptional $51,715 |
| Egyptians | 99.9 /100 | #55 | Exceptional $51,701 |
| Immigrants | Pakistan | 99.9 /100 | #56 | Exceptional $51,693 |
| Immigrants | Eastern Europe | 99.9 /100 | #57 | Exceptional $51,624 |
| Immigrants | Bolivia | 99.9 /100 | #58 | Exceptional $51,605 |
| Immigrants | Croatia | 99.9 /100 | #59 | Exceptional $51,581 |
| Immigrants | Serbia | 99.9 /100 | #60 | Exceptional $51,557 |
| Immigrants | Latvia | 99.9 /100 | #61 | Exceptional $51,555 |
| Immigrants | Romania | 99.9 /100 | #62 | Exceptional $51,337 |
| Immigrants | Bulgaria | 99.9 /100 | #63 | Exceptional $51,318 |
| New Zealanders | 99.9 /100 | #64 | Exceptional $51,246 |
| Greeks | 99.9 /100 | #65 | Exceptional $51,164 |
| Afghans | 99.9 /100 | #66 | Exceptional $51,112 |
| Immigrants | Spain | 99.9 /100 | #67 | Exceptional $51,092 |
| Paraguayans | 99.9 /100 | #68 | Exceptional $51,068 |
Demographics Similar to Kenyans by Median Earnings
In terms of median earnings, the demographic groups most similar to Kenyans are Scottish ($46,463, a difference of 0.0%), Immigrants ($46,478, a difference of 0.030%), Ghanaian ($46,440, a difference of 0.050%), Scandinavian ($46,433, a difference of 0.060%), and Basque ($46,399, a difference of 0.14%).
| Demographics | Rating | Rank | Median Earnings |
| South Americans | 62.7 /100 | #165 | Good $46,804 |
| Czechoslovakians | 57.8 /100 | #166 | Average $46,658 |
| Costa Ricans | 57.4 /100 | #167 | Average $46,645 |
| Immigrants | Africa | 54.6 /100 | #168 | Average $46,564 |
| Immigrants | South America | 54.0 /100 | #169 | Average $46,548 |
| Immigrants | Immigrants | 51.6 /100 | #170 | Average $46,478 |
| Scottish | 51.1 /100 | #171 | Average $46,463 |
| Kenyans | 51.0 /100 | #172 | Average $46,462 |
| Ghanaians | 50.3 /100 | #173 | Average $46,440 |
| Scandinavians | 50.0 /100 | #174 | Average $46,433 |
| Basques | 48.8 /100 | #175 | Average $46,399 |
| Danes | 48.6 /100 | #176 | Average $46,392 |
| Belgians | 48.0 /100 | #177 | Average $46,375 |
| Colombians | 47.1 /100 | #178 | Average $46,349 |
| English | 46.5 /100 | #179 | Average $46,334 |