Immigrants from Latvia vs Puerto Rican Median Earnings
COMPARE
Immigrants from Latvia
Puerto Rican
Median Earnings
Median Earnings Comparison
Immigrants from Latvia
Puerto Ricans
$51,555
MEDIAN EARNINGS
99.9/ 100
METRIC RATING
61st/ 347
METRIC RANK
$35,560
MEDIAN EARNINGS
0.0/ 100
METRIC RATING
347th/ 347
METRIC RANK
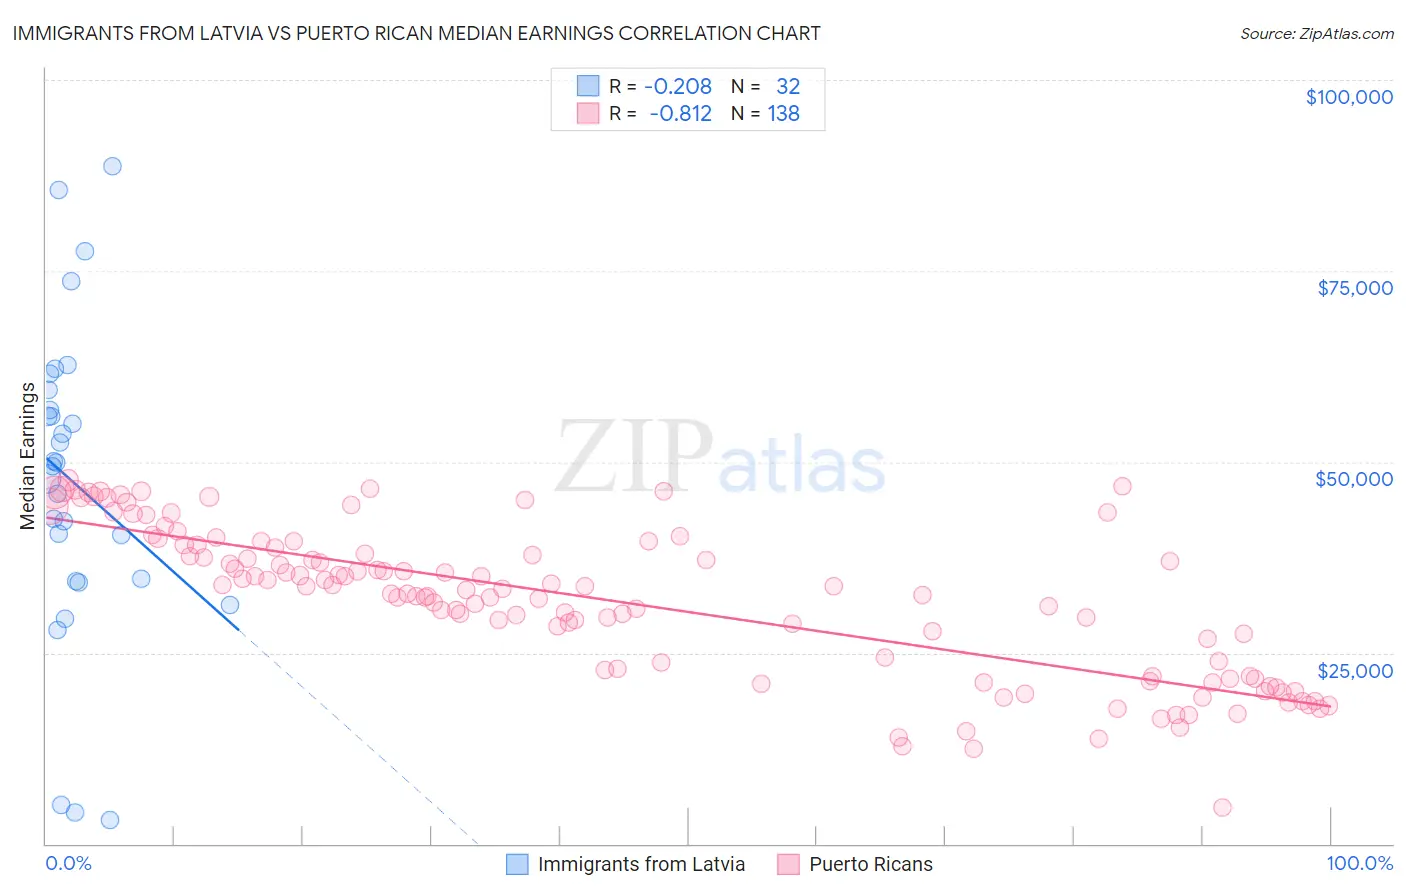
Immigrants from Latvia vs Puerto Rican Median Earnings Correlation Chart
The statistical analysis conducted on geographies consisting of 113,739,608 people shows a weak negative correlation between the proportion of Immigrants from Latvia and median earnings in the United States with a correlation coefficient (R) of -0.208 and weighted average of $51,555. Similarly, the statistical analysis conducted on geographies consisting of 528,218,544 people shows a very strong negative correlation between the proportion of Puerto Ricans and median earnings in the United States with a correlation coefficient (R) of -0.812 and weighted average of $35,560, a difference of 45.0%.
Median Earnings Correlation Summary
| Measurement | Immigrants from Latvia | Puerto Rican |
| Minimum | $3,188 | $4,737 |
| Maximum | $88,678 | $47,601 |
| Range | $85,490 | $42,864 |
| Mean | $47,322 | $31,795 |
| Median | $49,671 | $33,297 |
| Interquartile 25% (IQ1) | $34,454 | $22,818 |
| Interquartile 75% (IQ3) | $58,094 | $39,100 |
| Interquartile Range (IQR) | $23,640 | $16,282 |
| Standard Deviation (Sample) | $20,618 | $9,771 |
| Standard Deviation (Population) | $20,294 | $9,736 |
Similar Demographics by Median Earnings
Demographics Similar to Immigrants from Latvia by Median Earnings
In terms of median earnings, the demographic groups most similar to Immigrants from Latvia are Immigrants from Serbia ($51,557, a difference of 0.0%), Immigrants from Croatia ($51,581, a difference of 0.050%), Immigrants from Bolivia ($51,605, a difference of 0.10%), Immigrants from Eastern Europe ($51,624, a difference of 0.13%), and Immigrants from Pakistan ($51,693, a difference of 0.27%).
| Demographics | Rating | Rank | Median Earnings |
| Immigrants | Indonesia | 99.9 /100 | #54 | Exceptional $51,715 |
| Egyptians | 99.9 /100 | #55 | Exceptional $51,701 |
| Immigrants | Pakistan | 99.9 /100 | #56 | Exceptional $51,693 |
| Immigrants | Eastern Europe | 99.9 /100 | #57 | Exceptional $51,624 |
| Immigrants | Bolivia | 99.9 /100 | #58 | Exceptional $51,605 |
| Immigrants | Croatia | 99.9 /100 | #59 | Exceptional $51,581 |
| Immigrants | Serbia | 99.9 /100 | #60 | Exceptional $51,557 |
| Immigrants | Latvia | 99.9 /100 | #61 | Exceptional $51,555 |
| Immigrants | Romania | 99.9 /100 | #62 | Exceptional $51,337 |
| Immigrants | Bulgaria | 99.9 /100 | #63 | Exceptional $51,318 |
| New Zealanders | 99.9 /100 | #64 | Exceptional $51,246 |
| Greeks | 99.9 /100 | #65 | Exceptional $51,164 |
| Afghans | 99.9 /100 | #66 | Exceptional $51,112 |
| Immigrants | Spain | 99.9 /100 | #67 | Exceptional $51,092 |
| Paraguayans | 99.9 /100 | #68 | Exceptional $51,068 |
Demographics Similar to Puerto Ricans by Median Earnings
In terms of median earnings, the demographic groups most similar to Puerto Ricans are Yup'ik ($35,942, a difference of 1.1%), Tohono O'odham ($36,349, a difference of 2.2%), Arapaho ($36,586, a difference of 2.9%), Pueblo ($36,859, a difference of 3.6%), and Hopi ($36,871, a difference of 3.7%).
| Demographics | Rating | Rank | Median Earnings |
| Houma | 0.0 /100 | #333 | Tragic $38,949 |
| Spanish American Indians | 0.0 /100 | #334 | Tragic $38,907 |
| Natives/Alaskans | 0.0 /100 | #335 | Tragic $38,896 |
| Crow | 0.0 /100 | #336 | Tragic $38,707 |
| Immigrants | Cuba | 0.0 /100 | #337 | Tragic $38,426 |
| Pima | 0.0 /100 | #338 | Tragic $38,285 |
| Menominee | 0.0 /100 | #339 | Tragic $37,884 |
| Navajo | 0.0 /100 | #340 | Tragic $36,999 |
| Lumbee | 0.0 /100 | #341 | Tragic $36,876 |
| Hopi | 0.0 /100 | #342 | Tragic $36,871 |
| Pueblo | 0.0 /100 | #343 | Tragic $36,859 |
| Arapaho | 0.0 /100 | #344 | Tragic $36,586 |
| Tohono O'odham | 0.0 /100 | #345 | Tragic $36,349 |
| Yup'ik | 0.0 /100 | #346 | Tragic $35,942 |
| Puerto Ricans | 0.0 /100 | #347 | Tragic $35,560 |