Immigrants from Latvia vs Nicaraguan Median Earnings
COMPARE
Immigrants from Latvia
Nicaraguan
Median Earnings
Median Earnings Comparison
Immigrants from Latvia
Nicaraguans
$51,555
MEDIAN EARNINGS
99.9/ 100
METRIC RATING
61st/ 347
METRIC RANK
$43,026
MEDIAN EARNINGS
0.8/ 100
METRIC RATING
262nd/ 347
METRIC RANK
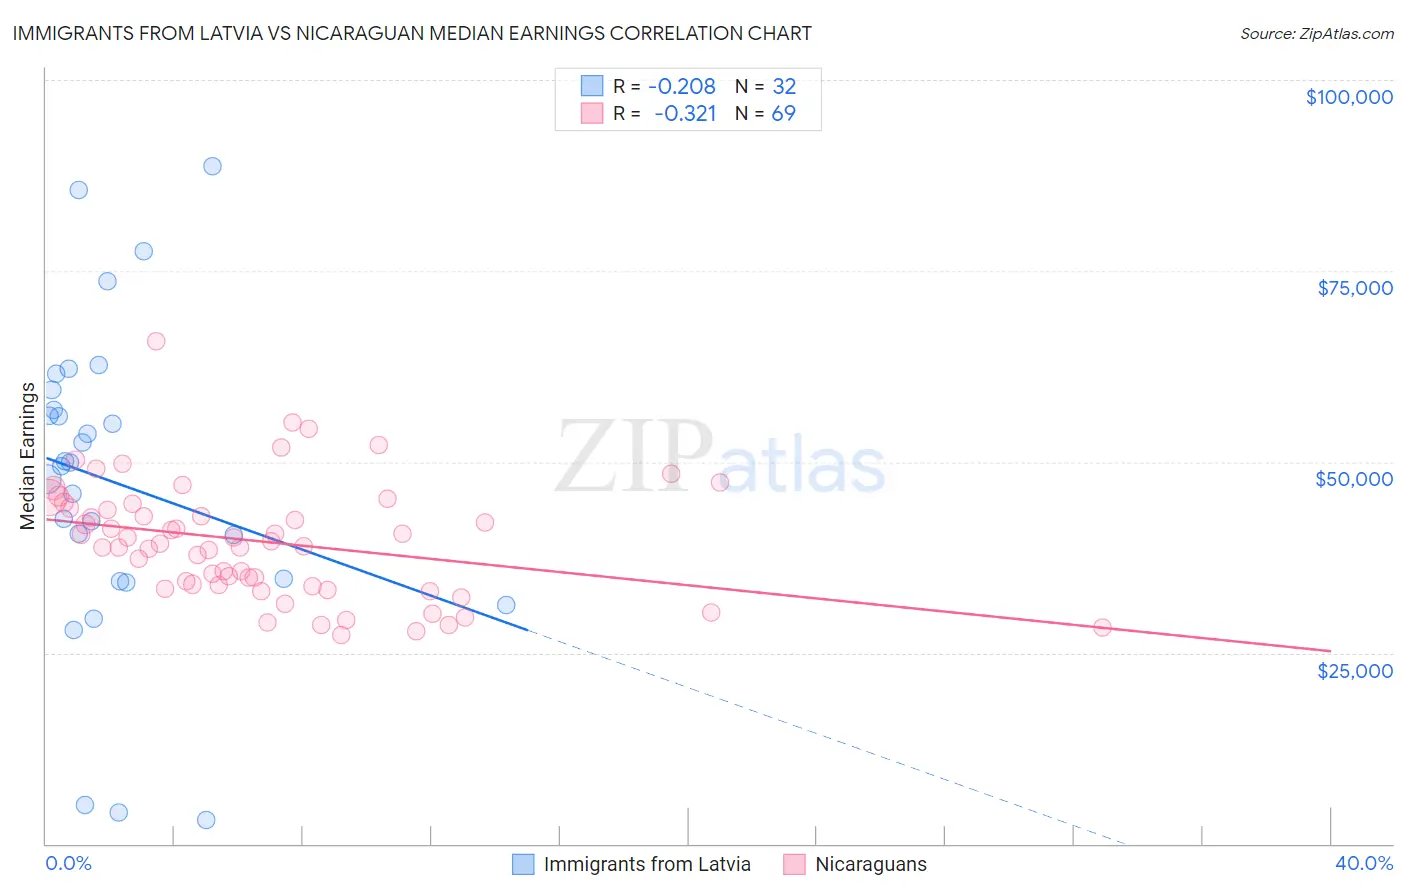
Immigrants from Latvia vs Nicaraguan Median Earnings Correlation Chart
The statistical analysis conducted on geographies consisting of 113,739,608 people shows a weak negative correlation between the proportion of Immigrants from Latvia and median earnings in the United States with a correlation coefficient (R) of -0.208 and weighted average of $51,555. Similarly, the statistical analysis conducted on geographies consisting of 285,714,618 people shows a mild negative correlation between the proportion of Nicaraguans and median earnings in the United States with a correlation coefficient (R) of -0.321 and weighted average of $43,026, a difference of 19.8%.
Median Earnings Correlation Summary
| Measurement | Immigrants from Latvia | Nicaraguan |
| Minimum | $3,188 | $27,330 |
| Maximum | $88,678 | $65,764 |
| Range | $85,490 | $38,434 |
| Mean | $47,322 | $39,567 |
| Median | $49,671 | $39,352 |
| Interquartile 25% (IQ1) | $34,454 | $33,795 |
| Interquartile 75% (IQ3) | $58,094 | $44,292 |
| Interquartile Range (IQR) | $23,640 | $10,497 |
| Standard Deviation (Sample) | $20,618 | $7,612 |
| Standard Deviation (Population) | $20,294 | $7,557 |
Similar Demographics by Median Earnings
Demographics Similar to Immigrants from Latvia by Median Earnings
In terms of median earnings, the demographic groups most similar to Immigrants from Latvia are Immigrants from Serbia ($51,557, a difference of 0.0%), Immigrants from Croatia ($51,581, a difference of 0.050%), Immigrants from Bolivia ($51,605, a difference of 0.10%), Immigrants from Eastern Europe ($51,624, a difference of 0.13%), and Immigrants from Pakistan ($51,693, a difference of 0.27%).
| Demographics | Rating | Rank | Median Earnings |
| Immigrants | Indonesia | 99.9 /100 | #54 | Exceptional $51,715 |
| Egyptians | 99.9 /100 | #55 | Exceptional $51,701 |
| Immigrants | Pakistan | 99.9 /100 | #56 | Exceptional $51,693 |
| Immigrants | Eastern Europe | 99.9 /100 | #57 | Exceptional $51,624 |
| Immigrants | Bolivia | 99.9 /100 | #58 | Exceptional $51,605 |
| Immigrants | Croatia | 99.9 /100 | #59 | Exceptional $51,581 |
| Immigrants | Serbia | 99.9 /100 | #60 | Exceptional $51,557 |
| Immigrants | Latvia | 99.9 /100 | #61 | Exceptional $51,555 |
| Immigrants | Romania | 99.9 /100 | #62 | Exceptional $51,337 |
| Immigrants | Bulgaria | 99.9 /100 | #63 | Exceptional $51,318 |
| New Zealanders | 99.9 /100 | #64 | Exceptional $51,246 |
| Greeks | 99.9 /100 | #65 | Exceptional $51,164 |
| Afghans | 99.9 /100 | #66 | Exceptional $51,112 |
| Immigrants | Spain | 99.9 /100 | #67 | Exceptional $51,092 |
| Paraguayans | 99.9 /100 | #68 | Exceptional $51,068 |
Demographics Similar to Nicaraguans by Median Earnings
In terms of median earnings, the demographic groups most similar to Nicaraguans are Immigrants from Jamaica ($43,026, a difference of 0.0%), Inupiat ($43,000, a difference of 0.060%), Immigrants from Somalia ($43,100, a difference of 0.17%), Immigrants from Liberia ($42,923, a difference of 0.24%), and Salvadoran ($42,912, a difference of 0.27%).
| Demographics | Rating | Rank | Median Earnings |
| Immigrants | Middle Africa | 1.4 /100 | #255 | Tragic $43,416 |
| Alaskan Athabascans | 1.4 /100 | #256 | Tragic $43,393 |
| Jamaicans | 1.3 /100 | #257 | Tragic $43,343 |
| French American Indians | 1.3 /100 | #258 | Tragic $43,333 |
| German Russians | 1.1 /100 | #259 | Tragic $43,200 |
| Immigrants | Somalia | 0.9 /100 | #260 | Tragic $43,100 |
| Immigrants | Jamaica | 0.8 /100 | #261 | Tragic $43,026 |
| Nicaraguans | 0.8 /100 | #262 | Tragic $43,026 |
| Inupiat | 0.8 /100 | #263 | Tragic $43,000 |
| Immigrants | Liberia | 0.7 /100 | #264 | Tragic $42,923 |
| Salvadorans | 0.7 /100 | #265 | Tragic $42,912 |
| Immigrants | Laos | 0.7 /100 | #266 | Tragic $42,884 |
| Cree | 0.6 /100 | #267 | Tragic $42,777 |
| Americans | 0.6 /100 | #268 | Tragic $42,742 |
| Belizeans | 0.5 /100 | #269 | Tragic $42,702 |