Immigrants from Latvia vs Immigrants from Honduras Disability
COMPARE
Immigrants from Latvia
Immigrants from Honduras
Disability
Disability Comparison
Immigrants from Latvia
Immigrants from Honduras
11.4%
DISABILITY
90.9/ 100
METRIC RATING
126th/ 347
METRIC RANK
11.8%
DISABILITY
37.8/ 100
METRIC RATING
180th/ 347
METRIC RANK
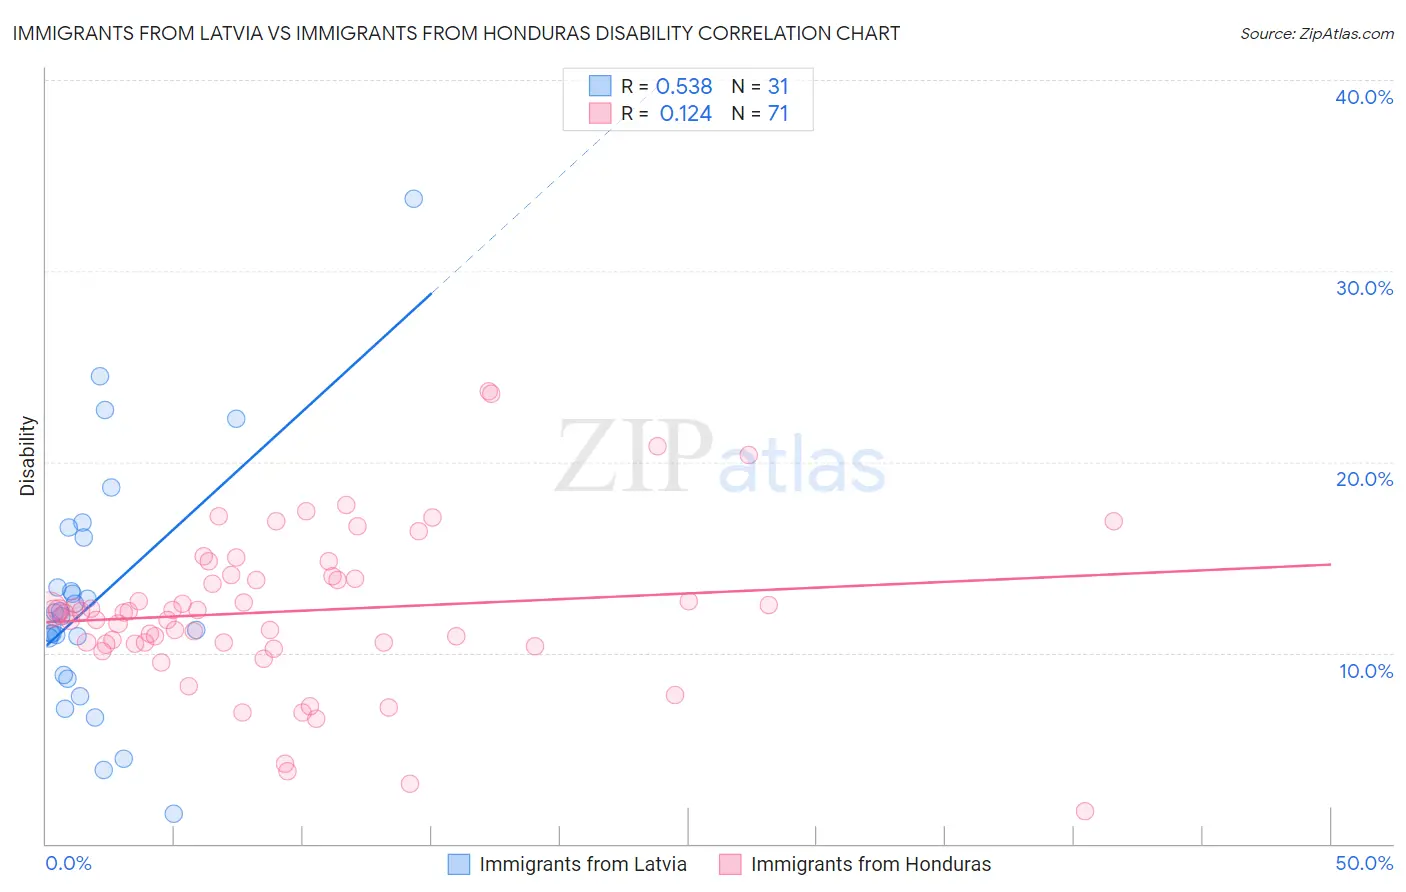
Immigrants from Latvia vs Immigrants from Honduras Disability Correlation Chart
The statistical analysis conducted on geographies consisting of 113,739,259 people shows a substantial positive correlation between the proportion of Immigrants from Latvia and percentage of population with a disability in the United States with a correlation coefficient (R) of 0.538 and weighted average of 11.4%. Similarly, the statistical analysis conducted on geographies consisting of 322,561,761 people shows a poor positive correlation between the proportion of Immigrants from Honduras and percentage of population with a disability in the United States with a correlation coefficient (R) of 0.124 and weighted average of 11.8%, a difference of 3.2%.
Disability Correlation Summary
| Measurement | Immigrants from Latvia | Immigrants from Honduras |
| Minimum | 1.5% | 1.7% |
| Maximum | 33.8% | 23.7% |
| Range | 32.2% | 22.0% |
| Mean | 12.9% | 12.2% |
| Median | 11.9% | 12.1% |
| Interquartile 25% (IQ1) | 8.8% | 10.5% |
| Interquartile 75% (IQ3) | 16.0% | 14.0% |
| Interquartile Range (IQR) | 7.2% | 3.5% |
| Standard Deviation (Sample) | 6.5% | 4.1% |
| Standard Deviation (Population) | 6.4% | 4.1% |
Similar Demographics by Disability
Demographics Similar to Immigrants from Latvia by Disability
In terms of disability, the demographic groups most similar to Immigrants from Latvia are Immigrants from Italy (11.4%, a difference of 0.070%), Immigrants from Europe (11.4%, a difference of 0.070%), Macedonian (11.4%, a difference of 0.080%), Latvian (11.4%, a difference of 0.14%), and Costa Rican (11.4%, a difference of 0.15%).
| Demographics | Rating | Rank | Disability |
| Central Americans | 93.5 /100 | #119 | Exceptional 11.4% |
| Immigrants | North Macedonia | 93.5 /100 | #120 | Exceptional 11.4% |
| Immigrants | Costa Rica | 93.4 /100 | #121 | Exceptional 11.4% |
| Brazilians | 93.3 /100 | #122 | Exceptional 11.4% |
| South Africans | 92.3 /100 | #123 | Exceptional 11.4% |
| South American Indians | 92.2 /100 | #124 | Exceptional 11.4% |
| Costa Ricans | 91.9 /100 | #125 | Exceptional 11.4% |
| Immigrants | Latvia | 90.9 /100 | #126 | Exceptional 11.4% |
| Immigrants | Italy | 90.4 /100 | #127 | Exceptional 11.4% |
| Immigrants | Europe | 90.4 /100 | #128 | Exceptional 11.4% |
| Macedonians | 90.3 /100 | #129 | Exceptional 11.4% |
| Latvians | 89.8 /100 | #130 | Excellent 11.4% |
| Immigrants | Croatia | 89.8 /100 | #131 | Excellent 11.4% |
| Immigrants | Africa | 89.3 /100 | #132 | Excellent 11.4% |
| Arabs | 89.1 /100 | #133 | Excellent 11.4% |
Demographics Similar to Immigrants from Honduras by Disability
In terms of disability, the demographic groups most similar to Immigrants from Honduras are Immigrants from Oceania (11.8%, a difference of 0.17%), Immigrants from Armenia (11.7%, a difference of 0.19%), Icelander (11.8%, a difference of 0.19%), Honduran (11.8%, a difference of 0.32%), and Greek (11.7%, a difference of 0.38%).
| Demographics | Rating | Rank | Disability |
| Maltese | 50.6 /100 | #173 | Average 11.7% |
| Albanians | 50.0 /100 | #174 | Average 11.7% |
| Haitians | 48.6 /100 | #175 | Average 11.7% |
| Immigrants | Western Africa | 47.5 /100 | #176 | Average 11.7% |
| Immigrants | Central America | 46.6 /100 | #177 | Average 11.7% |
| Greeks | 46.2 /100 | #178 | Average 11.7% |
| Immigrants | Armenia | 41.9 /100 | #179 | Average 11.7% |
| Immigrants | Honduras | 37.8 /100 | #180 | Fair 11.8% |
| Immigrants | Oceania | 34.3 /100 | #181 | Fair 11.8% |
| Icelanders | 34.0 /100 | #182 | Fair 11.8% |
| Hondurans | 31.2 /100 | #183 | Fair 11.8% |
| Iraqis | 30.0 /100 | #184 | Fair 11.8% |
| Immigrants | Burma/Myanmar | 28.5 /100 | #185 | Fair 11.8% |
| Immigrants | Scotland | 28.2 /100 | #186 | Fair 11.8% |
| Lebanese | 27.9 /100 | #187 | Fair 11.8% |